
Whether the source to produce energy is from oil, natural gas, and other types of fossil fuels; nuclear power; or wind, hydroelectricity, solar energy, and other renewable sources, energy has played an important and critical role in the advancement of technology and the improvement of society in general…
40 Years of Energy Consumption By Each Country Visualized Around the World
…but how have people in countries around the world consumed energy over the past 40 years — and what types of fuel was used to produce that energy?
To find out the answers to those questions and visualize the data, global energy production and consumption data from the Energy Information Administration of the United States — every year from 1980 to 2019 — was used. Country population data was sourced from Worldometer.
Global energy consumption is measured in British Thermal Units — or BTU — which is defined as the amount of energy when burned required to heat one pound or 453 milliliters of water by one degree Fahrenheit.
Energy consumption per capita in British Thermal Units is calculated by dividing the total energy consumption of a country divided by its population total.
For the energy production charts, the units were kept as Quad British Thermal Units — which is a measurement based on one quadrillion British Thermal Units.
For the timeline charts, all nations were grouped by continent — except for the top ten energy producers of that type — based on 2019 figures.
The data was collected in March 2022.
This article from 911 Metallurgist gives more details about 40 years of energy consumption by each country visualized around the world; and I have been given express written permission to use the graphs and the verbatim text from the aforementioned article in this article. While 911 Metallurgist has endeavored to ensure the information provided is accurate and current, it cannot guarantee it, as this information is general in nature only and does not constitute personal advice. Neither 911 Metallurgist nor The Gate accept any liability — and assume no responsibility — for any and all information which is presented in this article.
With that disclaimer out of the way, here is the article.
What Types of Fuel Was Used to Produce Energy Over the Past 40 Years in Each Country Around the World?
When future generations tell the story of the 21st century, energy will be a leading character.
War in the oil-rich Middle East gave way to climate crisis headlines, and a teenage schoolgirl downing tools became emblematic of the push for alternative energies. Lately, the energy sector took one of the biggest hits during the first year of Covid-19, although it made an astounding recovery in 2021.
Two decades after Iraq, mainstream attention has turned to Russia’s hold on European energy supplies. Efforts to escape this hold may be what supercharges humankind’s move to green energy.
Today, as energy prices and stocks soar, consumers are taking an interest in where their energy is produced. To guide the way, experts at 911 Metallurgist have visualized authoritative U.S. Energy Information Administration data on the changes in production and consumption of energy around the world over the past four decades – because the story isn’t over yet.
Scroll on to discover who has produced the most fossil fuel, nuclear, and renewable energy since 1980. All figures refer to the British thermal unit (BTU), a unit of energy equivalent to the heat required to heat one pound of water by one degree Fahrenheit.
40 Years of Global Energy Production Swayed by Recession and Good Intentions
Our first chart illustrates global growth in the production of fossil fuels and renewables over the past 40 years. Industry and economy march hand in hand, with the dip in overall energy production in 2009 attributed to the ‘Great Recession.’
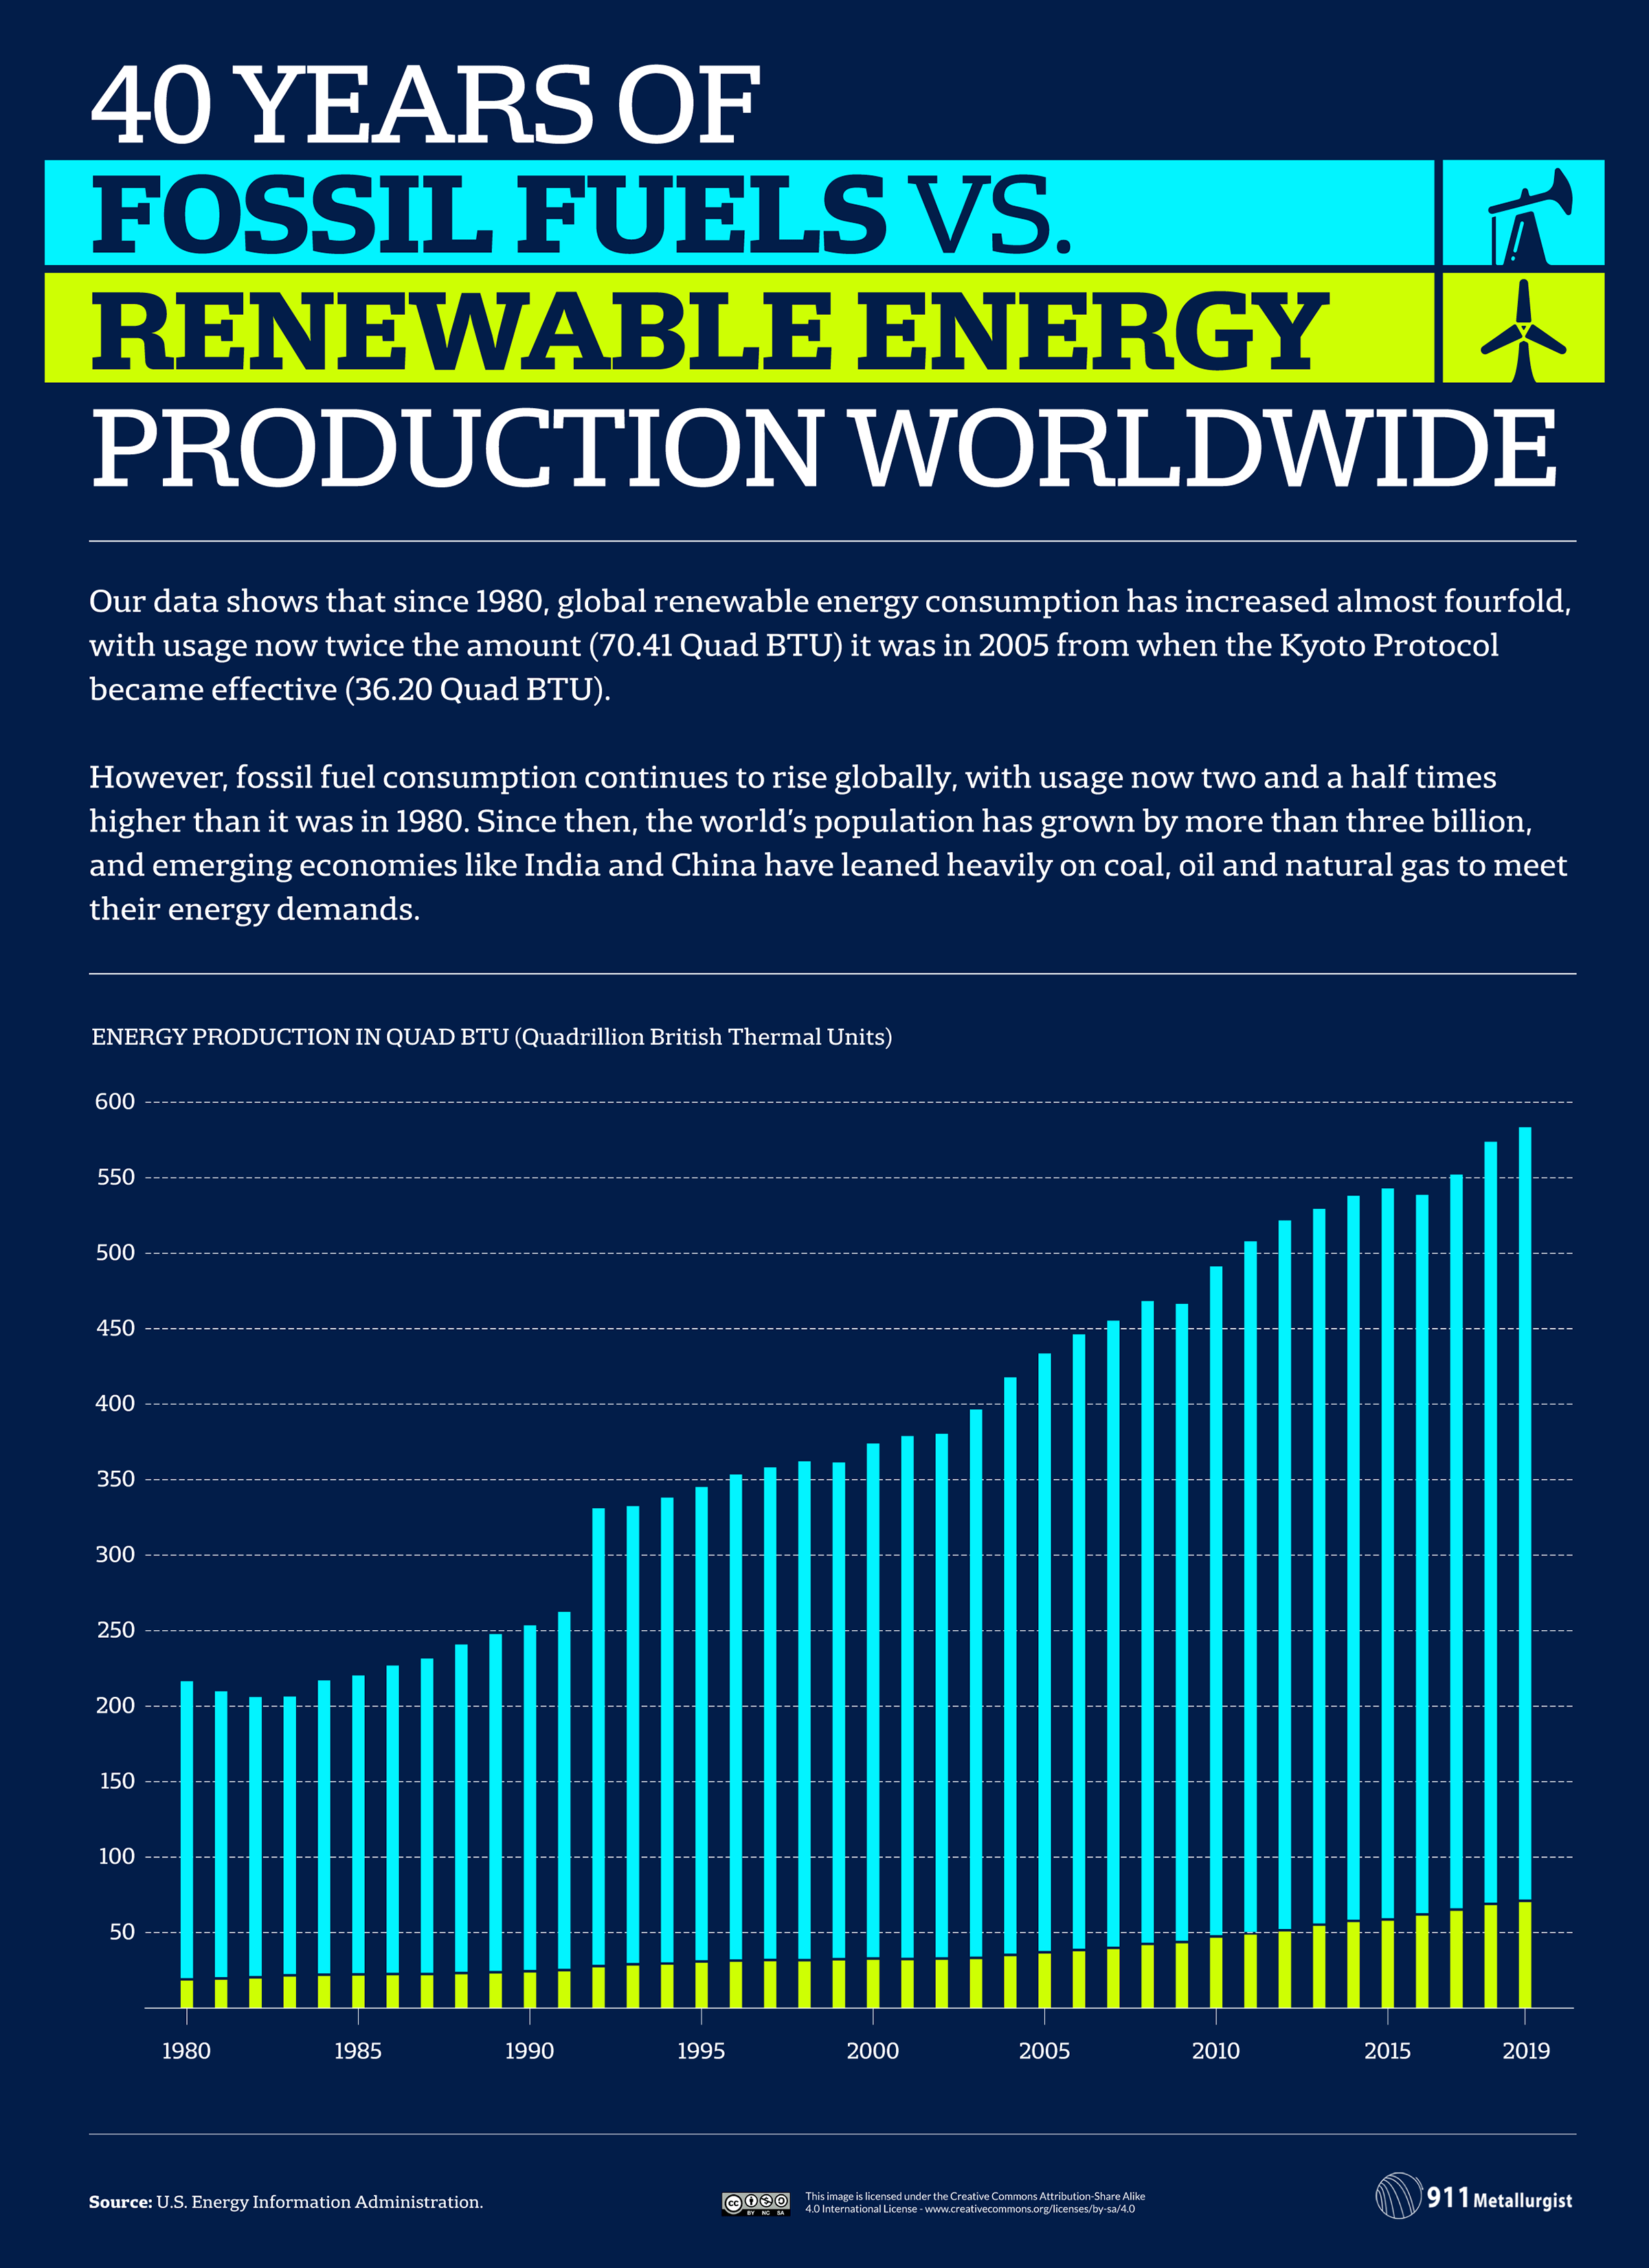
Politics also have a role to play. Production of renewables hastened after 2005, when the Kyoto Protocol came into force, first committing 37 industrialized countries to “5 percent emission reduction compared to 1990 levels over the five-year period 2008–2012.” And the apparent leap in fossil fuel production in 1992 represents the moment that USSR region data became available – although, at that moment, the Russian energy sector was actually in decline.
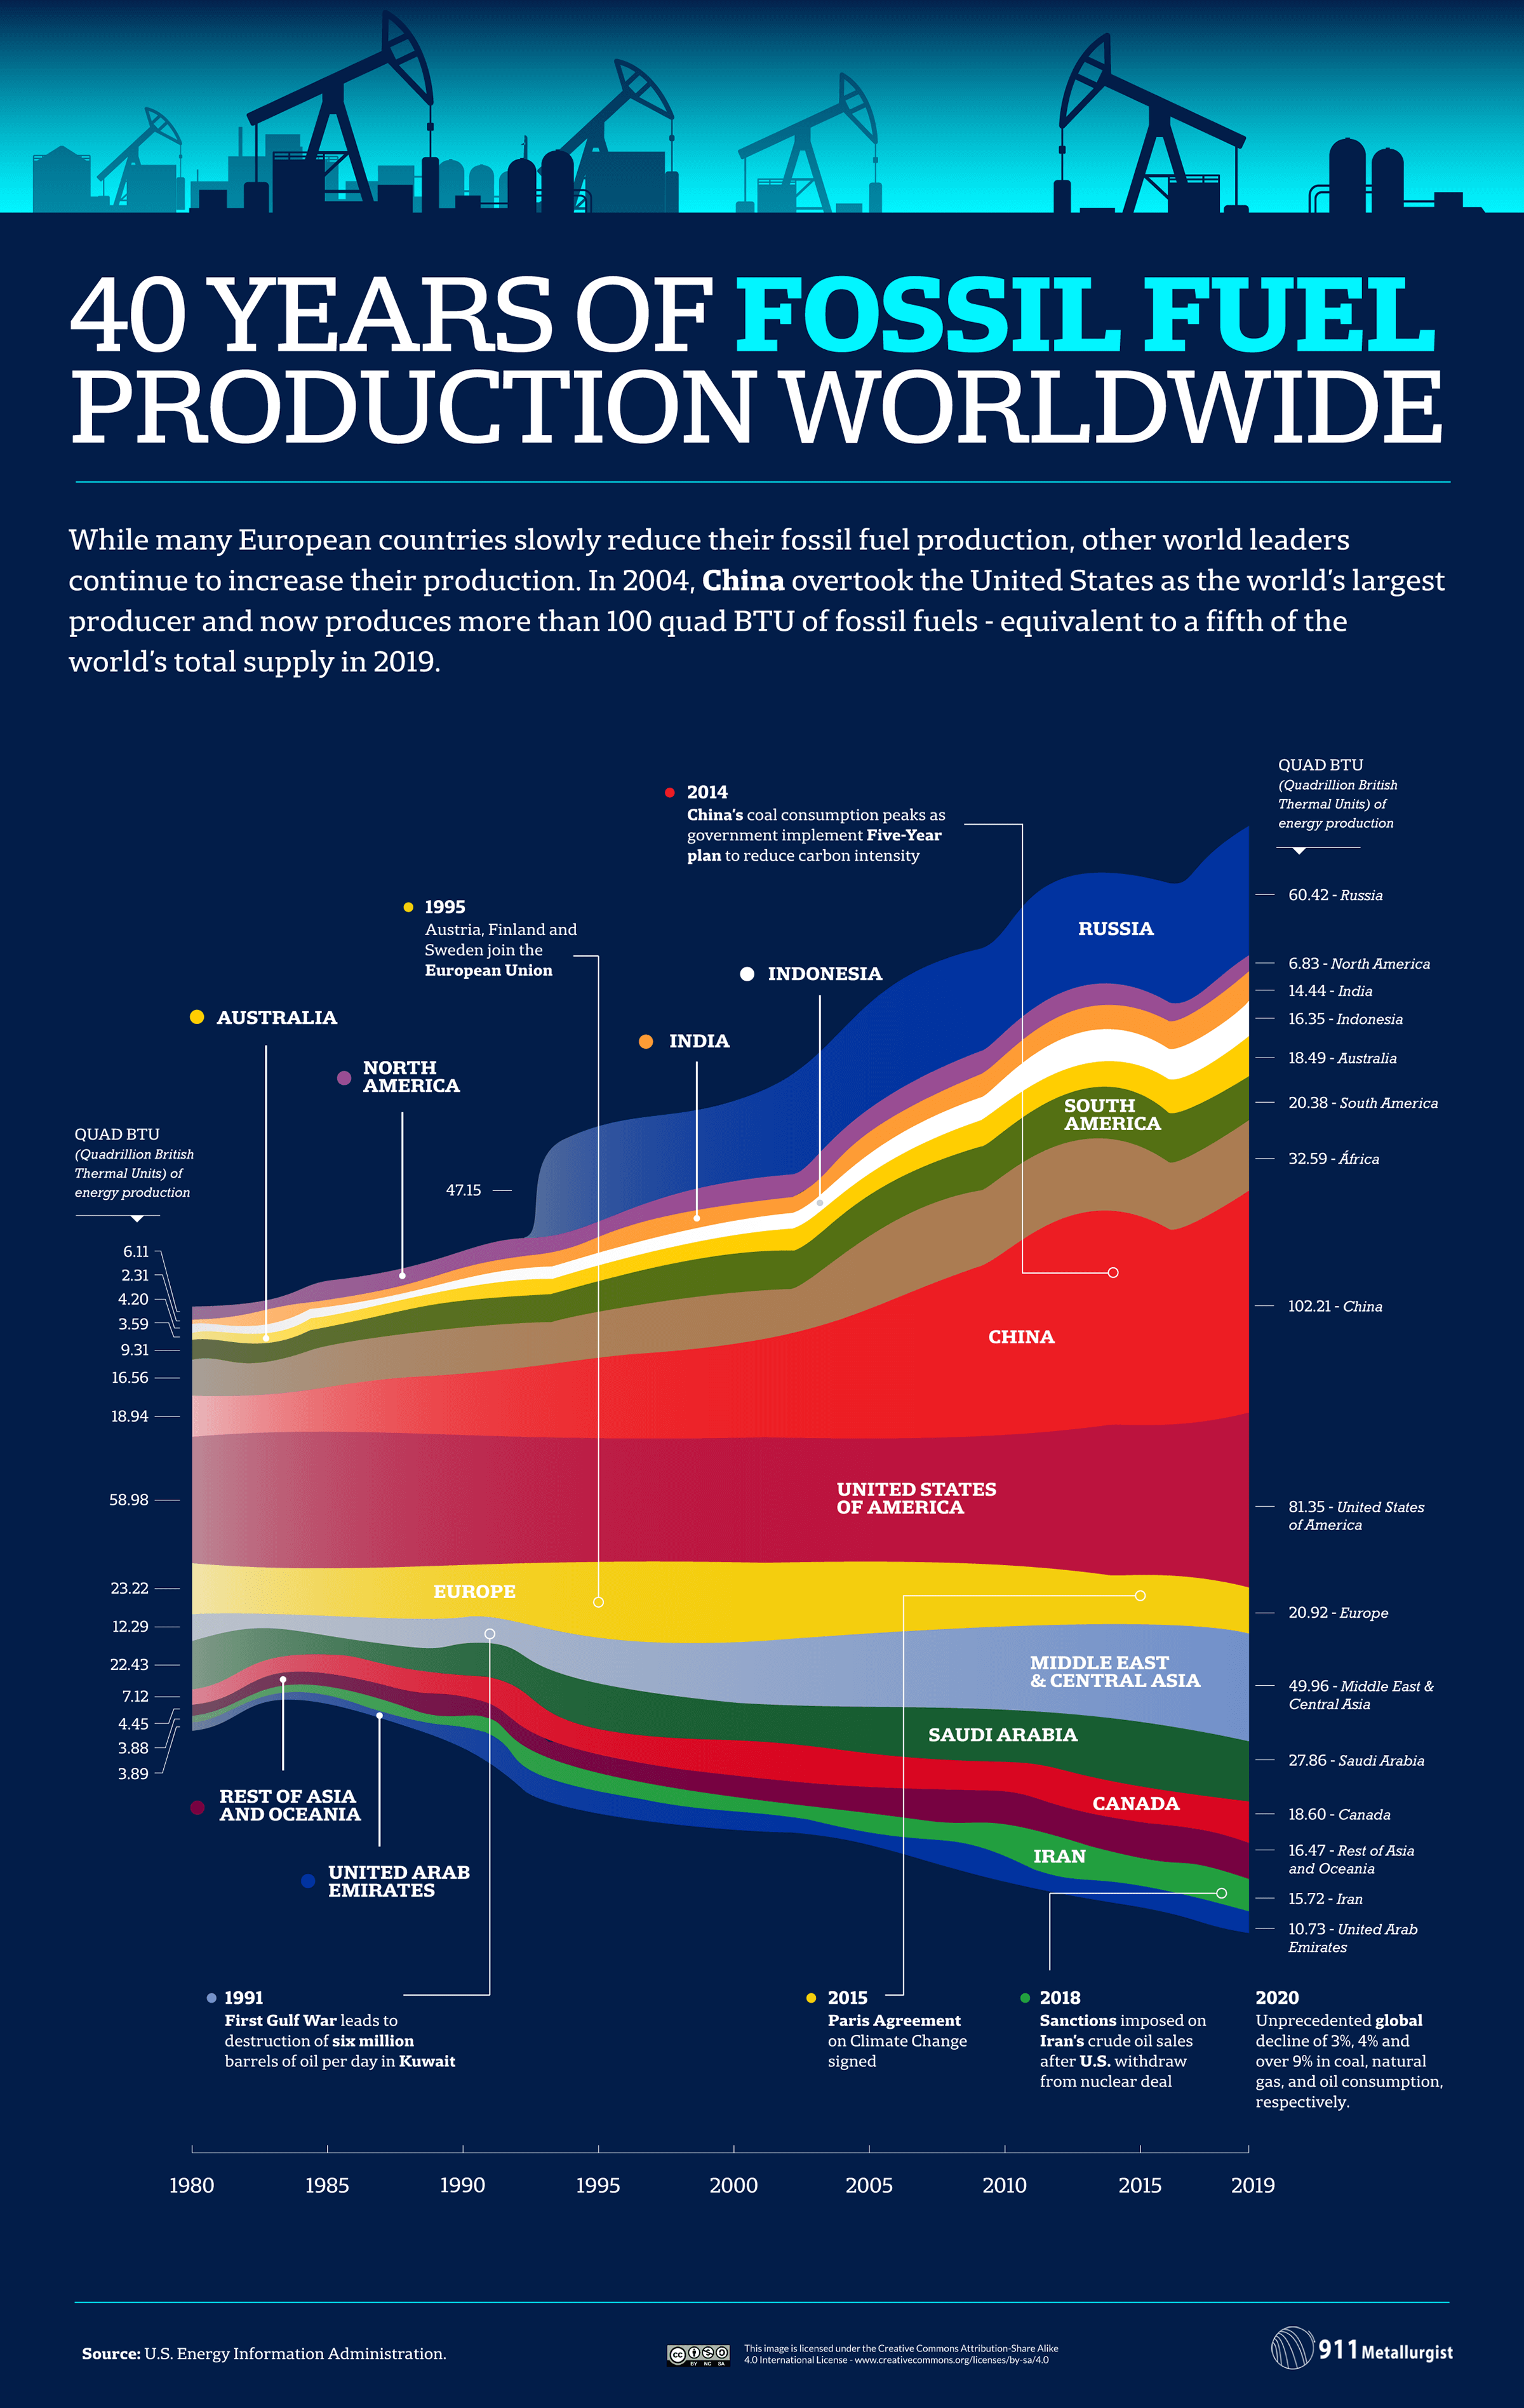
China is the World Giant of Fossil Fuel Production
China has the world’s largest fossil fuel production. The burning of coal, in particular, has contributed to our chart’s most dramatic four-decade growth, as China’s industrial sector witnessed unparalleled growth. Lately, China was one of just 5% of countries where energy consumption continued to grow in 2020 when Covid-19 led to widespread lockdowns. This growth includes coal, a fossil fuel for which more than half of the world’s production and consumption occurs in China.
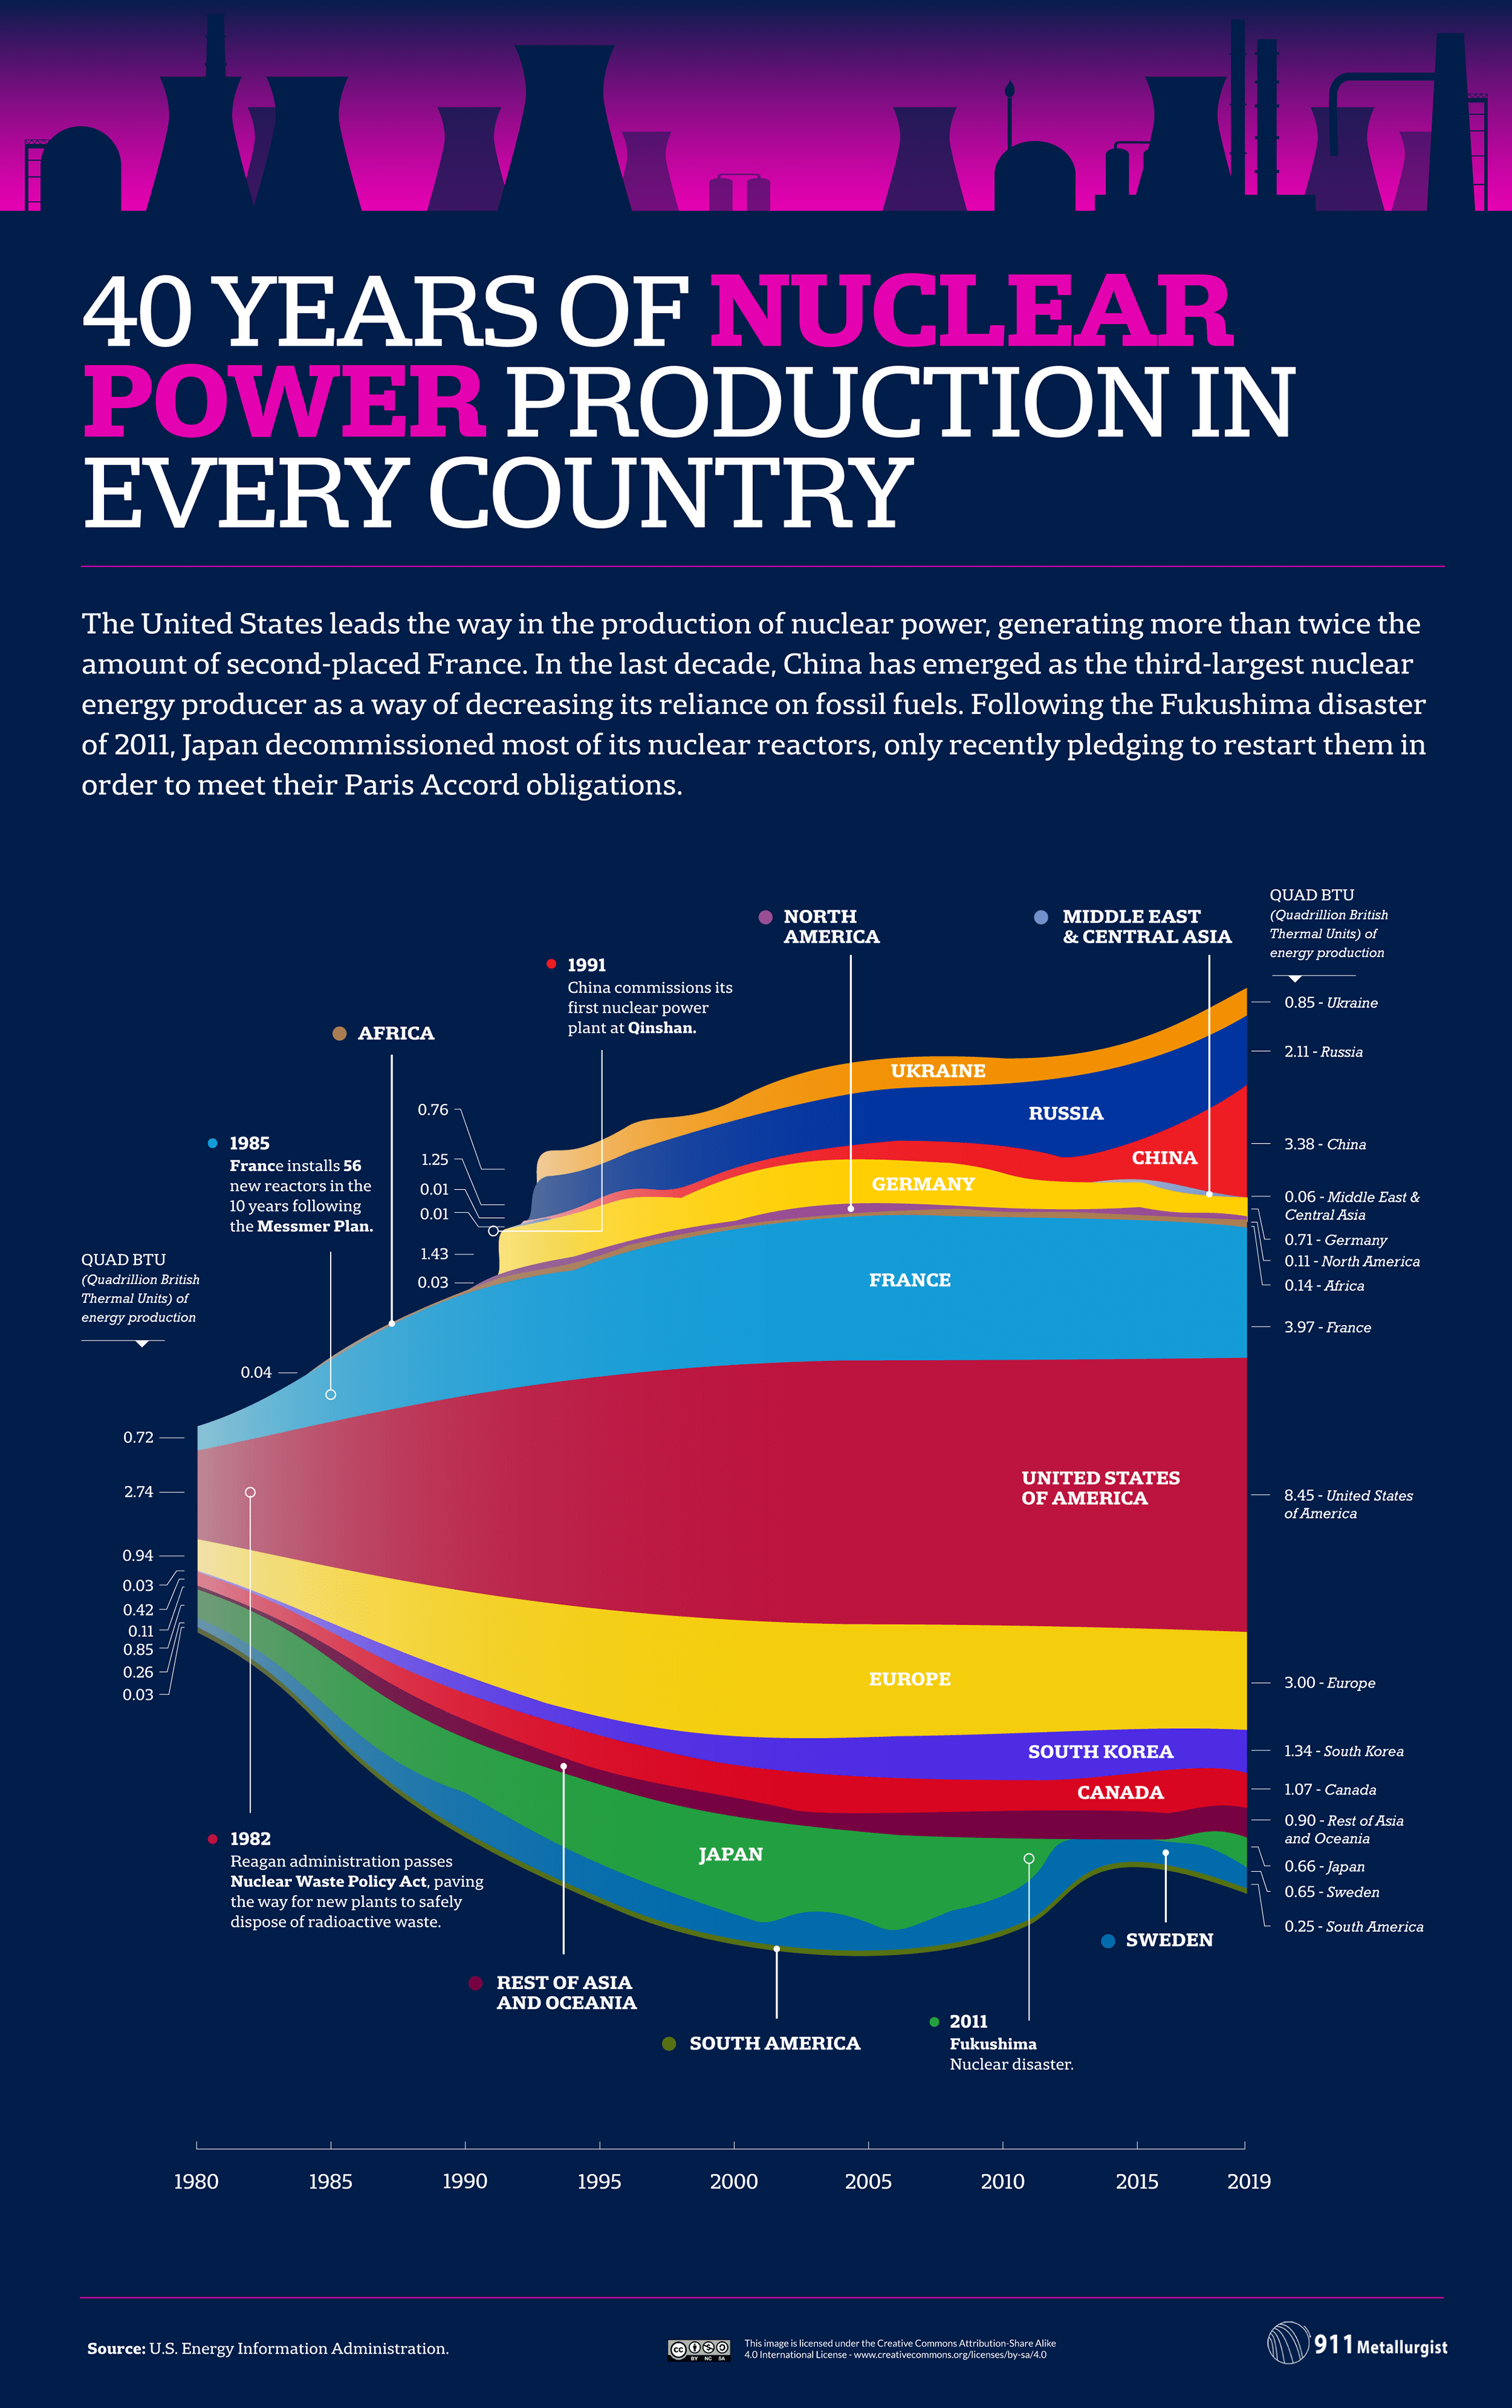
France and China Follow U.S. for Nuclear Energy Production
Nuclear energy occupies a kind of middle-ground for energy observers, with low emissions and long-term costs balanced by the threat of deadly radioactive waste and the initial complexity involved. The U.S., France, and China lead the way with nuclear power. While it may seem that the relatively small nation of France has been wavering over nuclear production for the past 10 years, President Emmanuel Macron has now signaled a commitment to building 14 new reactors by 2050, controversially calling the move a “choice of progress, a choice of confidence in science and technology.”
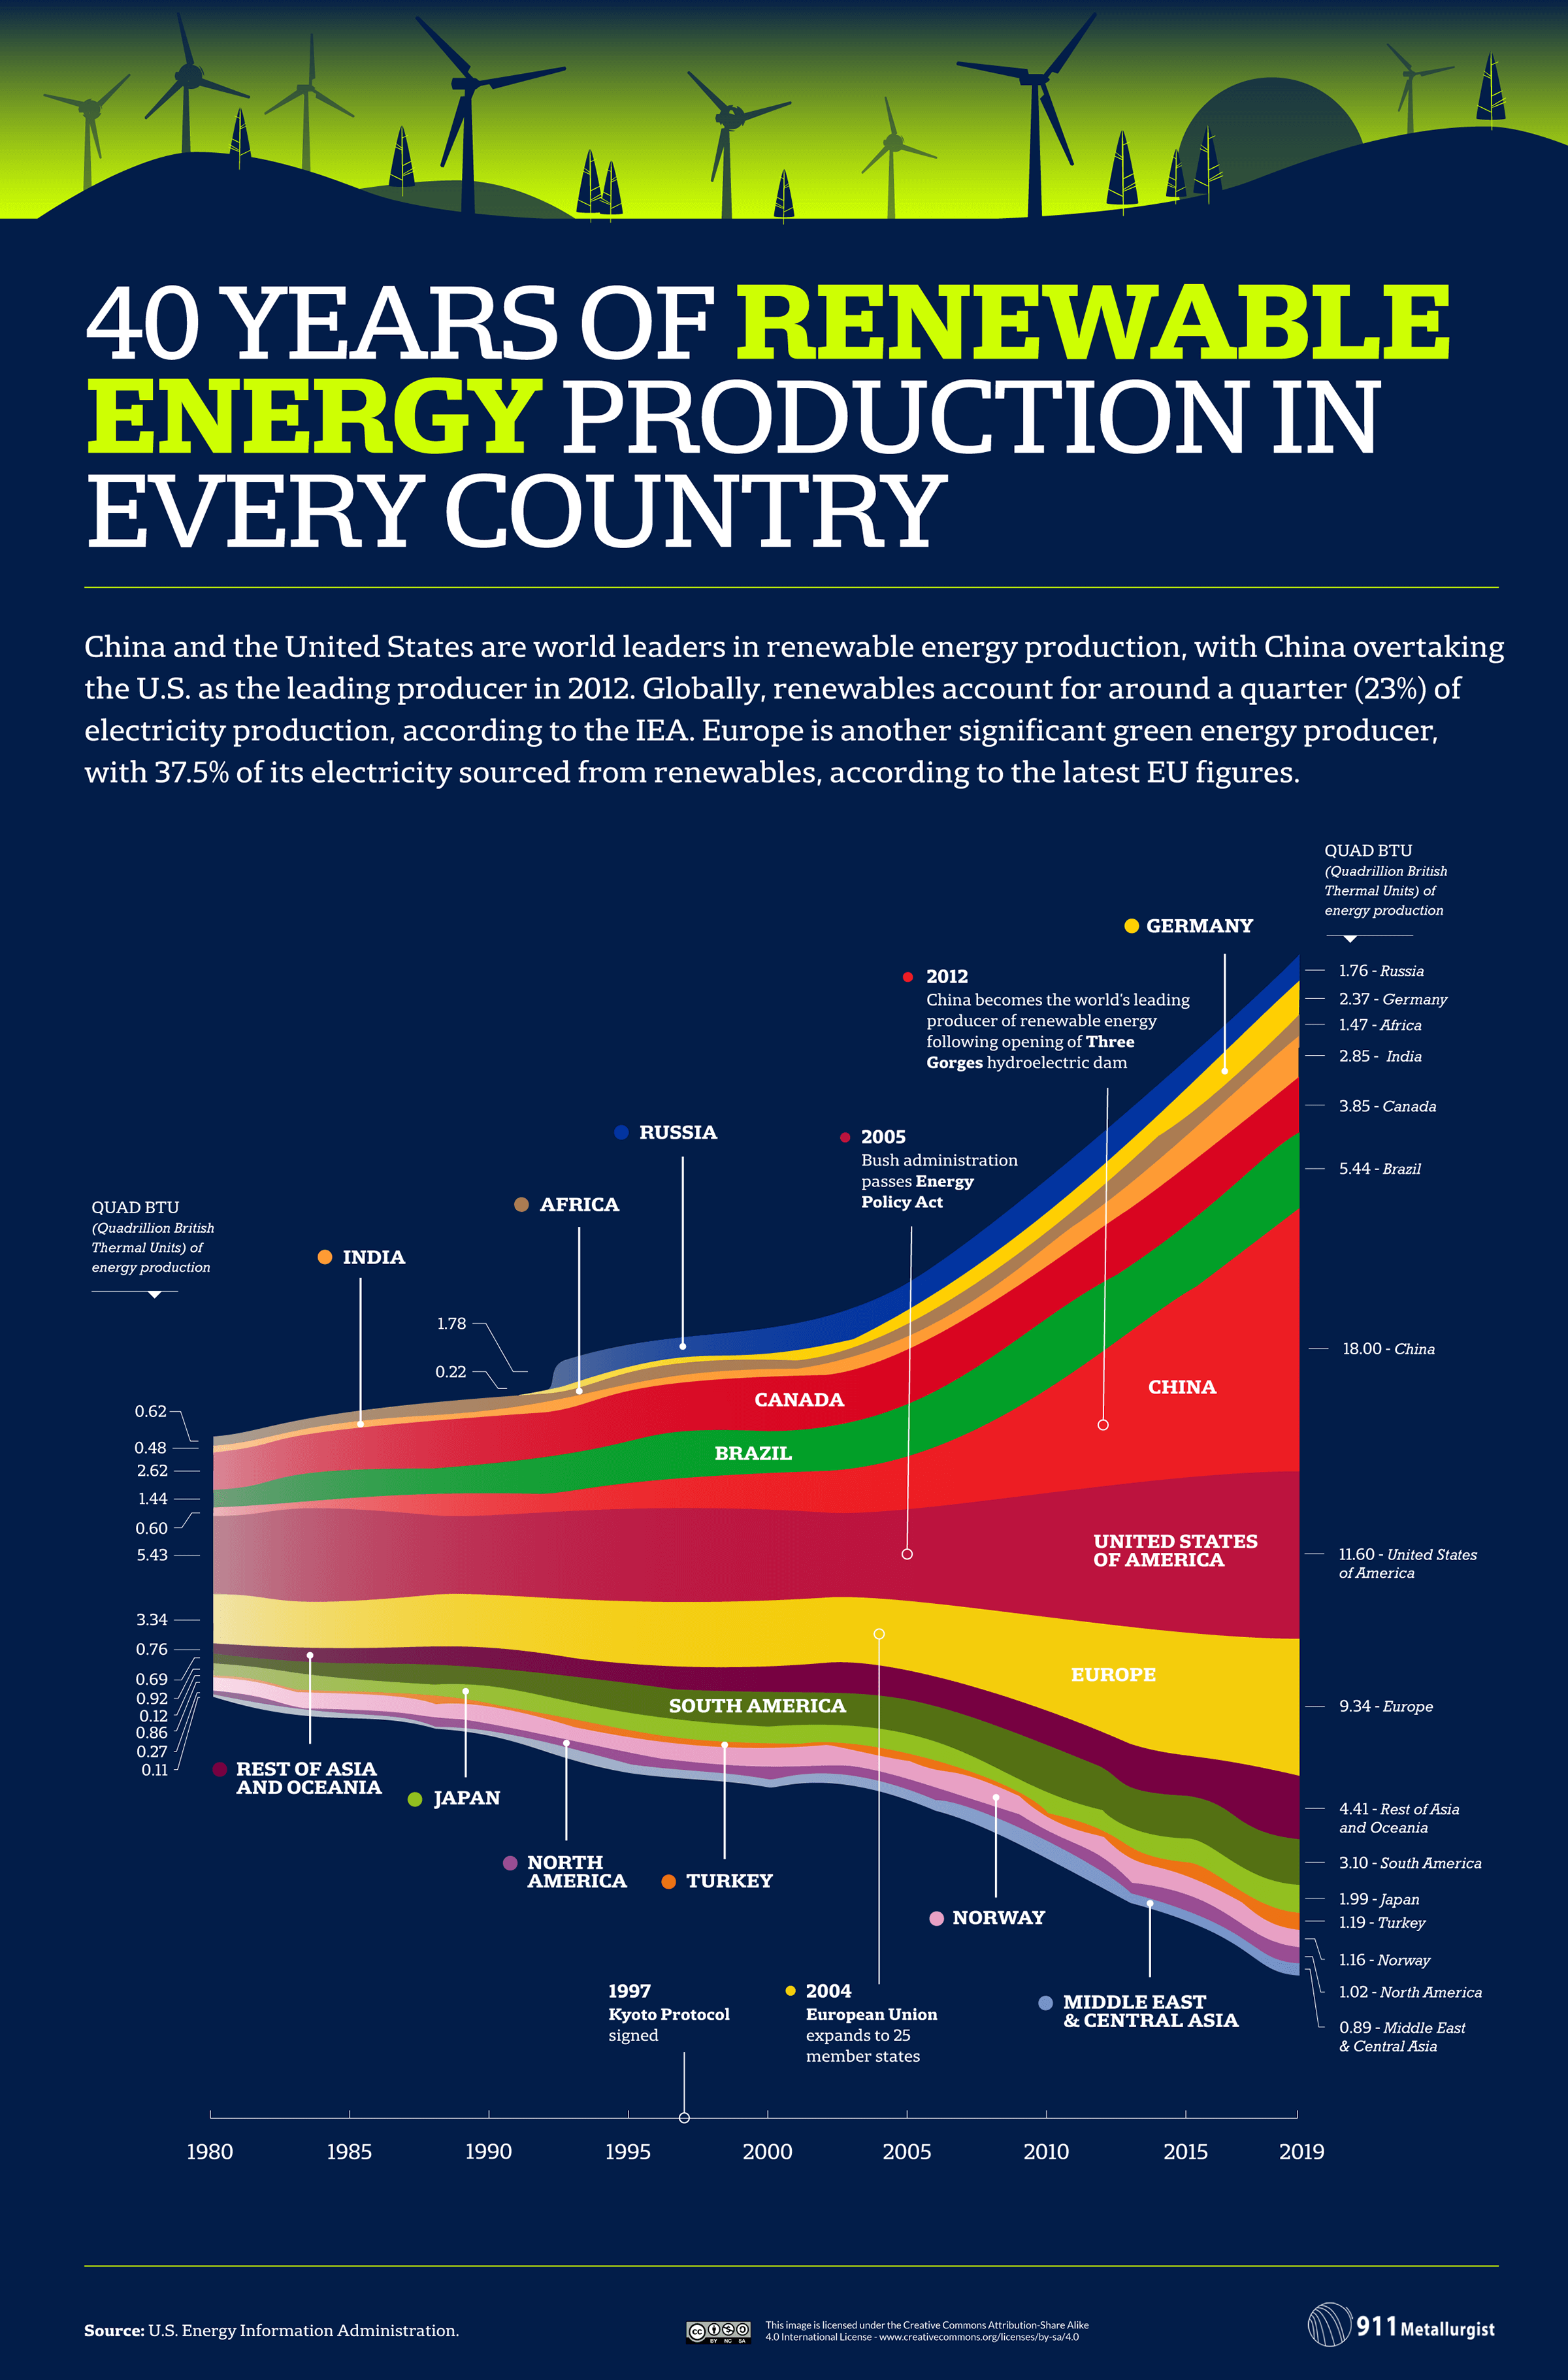
China Pursues Economic and Health Benefits of Renewables
Renewables include hydroelectric power and biomass, solar, tidal, wave, and wind energy. Unlike fossil fuels, their supply is not finite. However, this doesn’t mean every renewable is good for the environment. For example, trees are renewable, but burning wood as biomass is bad for the climate, air quality, forestry, and communities. Despite its record on ‘dirty’ energy, China has invested heavily in renewables, particularly over the past half-decade. Before this, the effect of air pollution on the labor force was estimated to cost China around $535 billion each year.
However, as our visualizations show, the picture is uneven around the world, and a united effort is required if countries with lower income are to fulfill their good intentions.
Icelanders Use World-Leading 500m BTU of Renewables Per Year
Finally, here’s a snapshot of where we are today: the annual energy consumption per person in every country. Click the category tabs below to show the countries that consume the most and least of each type of energy today.

Iceland has zero natural gas and nuclear consumption, depending almost entirely on electricity produced with renewable hydropower (73%) and geothermal power (27%). Indeed, the average person in Iceland uses more renewable energy than any other nation. While Iceland does have a geographical advantage when it comes to geothermal energy, the country benefited from a wholehearted commitment to renewables during the oil crisis of the 1970s – doubling down following the crisis while other governments were abandoning short-lived alternatives to fossil fuels.
Globally, the slow switch to renewable energy may gain speed as economic and political pressures make the alternatives unviable. The price of wind energy has dropped by 74% since 2008, exemplifying the impact that greener choices can make at a global and nationwide level and in the home, with some home renewable energy systems in the U.S. even producing enough for consumers to sell power back to providers.
Final Boarding Call
A key challenge for humankind is to produce enough energy for everyone to enjoy with as little disturbance to the natural environment as possible while keeping the cost of that energy as affordable as possible. This means trying not to disturb the land from which the source of energy is extracted; keeping the level of pollution in the air and water as low as possible; and not cluttering the landscape with obviously visible technology which ruins the views of what otherwise would be pristine landscapes — but yet ensuring that everyone on the planet has easy access to energy.
Great strides have been achieved in ensuring that the quality of air and water are significantly cleaner than they were 100 years ago — and yes, we can do even more to better further that goal — but we also cannot go overboard, either. Regardless of how you feel about the environment, most of us need energy to survive as a society.
Fortunately, technology over the years has afforded us a plethora of options in terms of sources of energy — from motor vehicles powered by used cooking oil from restaurants and buses powered by human fecal waste to such energy sources as coal, natural gas, oil, nuclear energy, methane from landfills and garbage dumps, wind by turbines, geothermal energy, tidal, solar energy, hydroelectric power, and even kinetic energy.
Despite the movement to do so, I do not believe that we will ever end the use of fossil fuels in favor of 100 percent renewable energy. Rather, I believe that a combination of all sources of energy — if used properly and intelligently — will be the solution to achieving as close to that precarious balance of energy nirvana as possible.
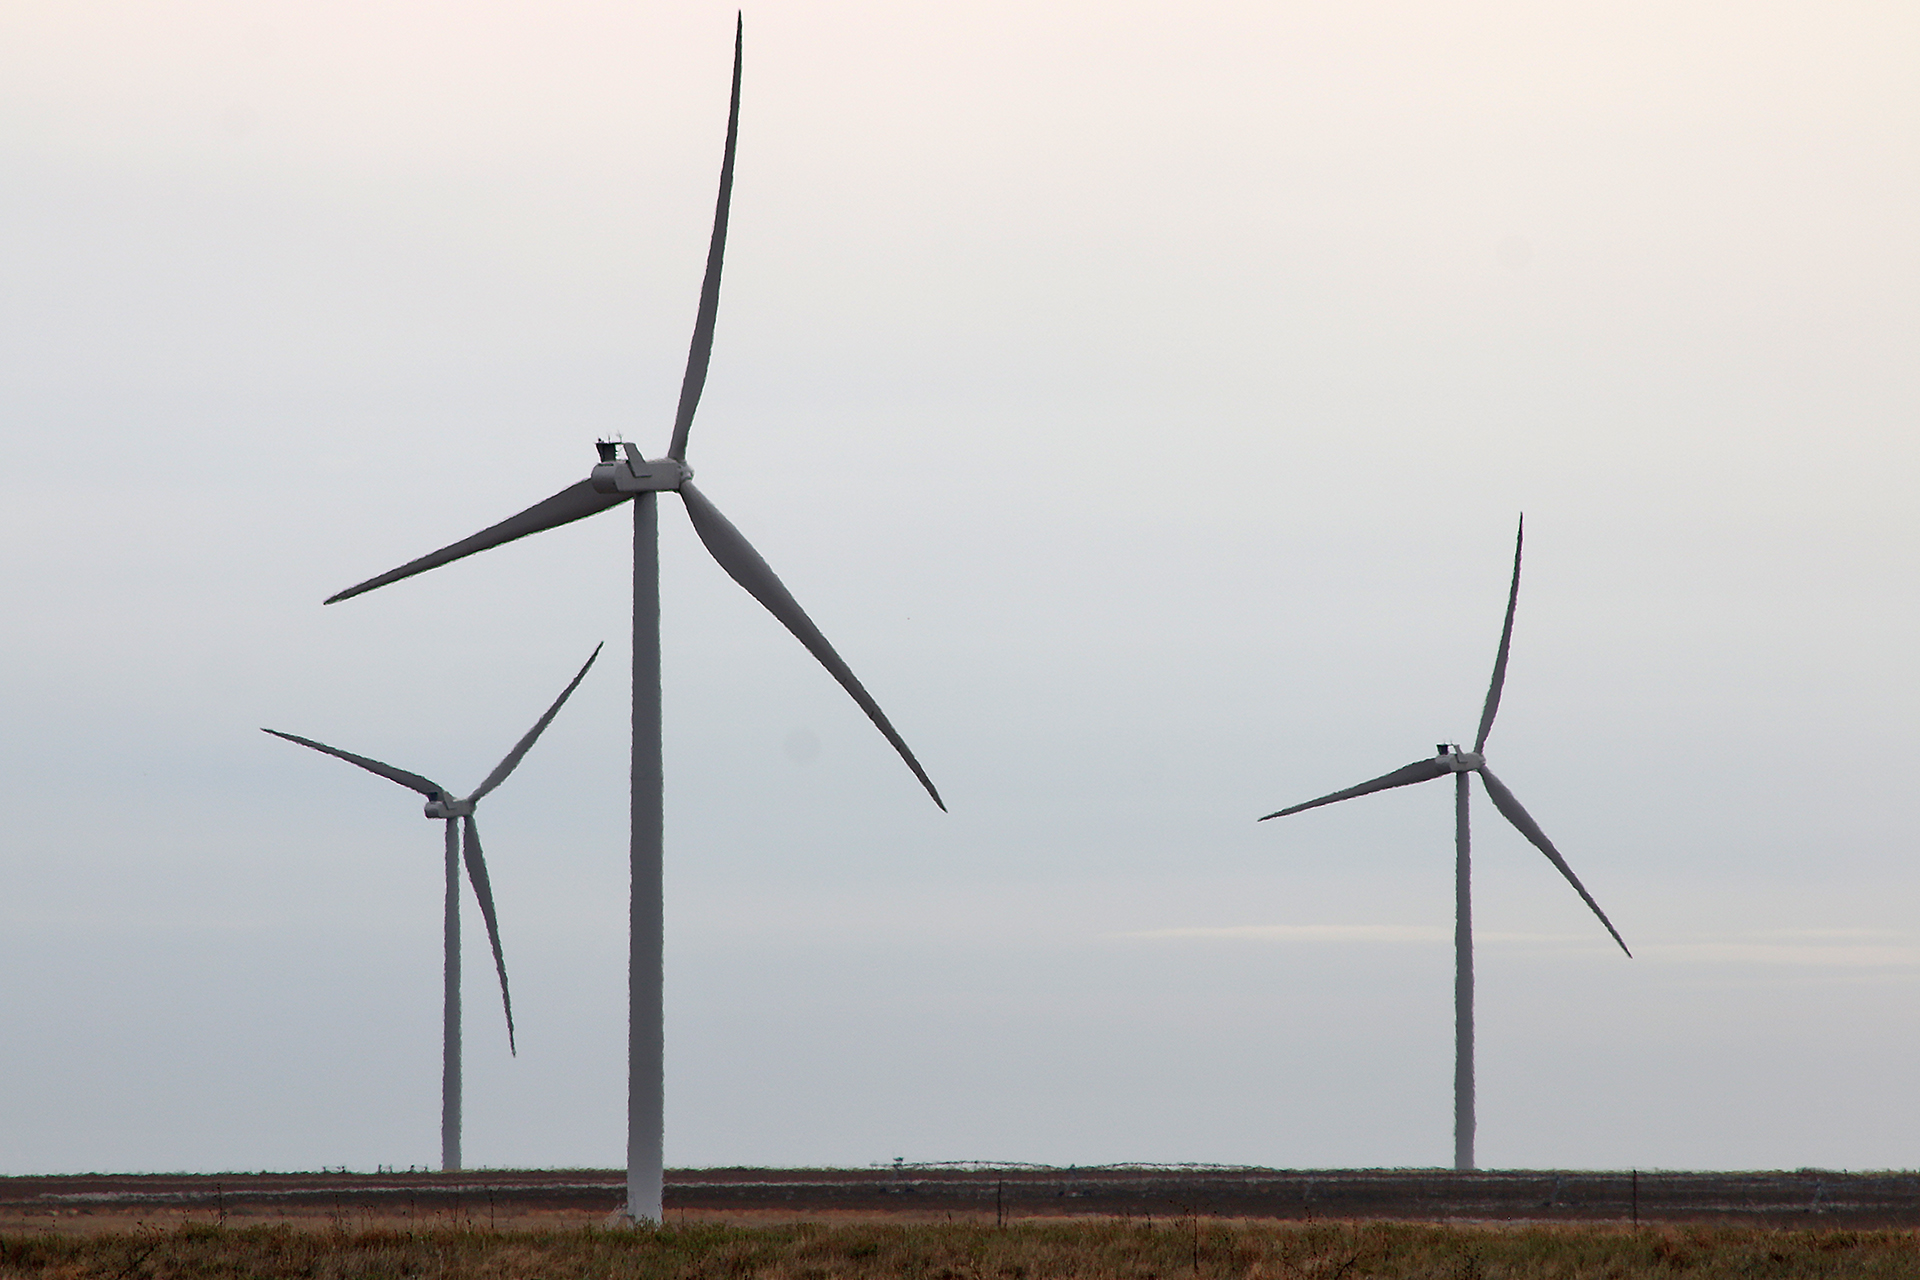
Wind turbines in northern Texas provide some electric power to the area. Photograph ©2017 by Brian Cohen.
