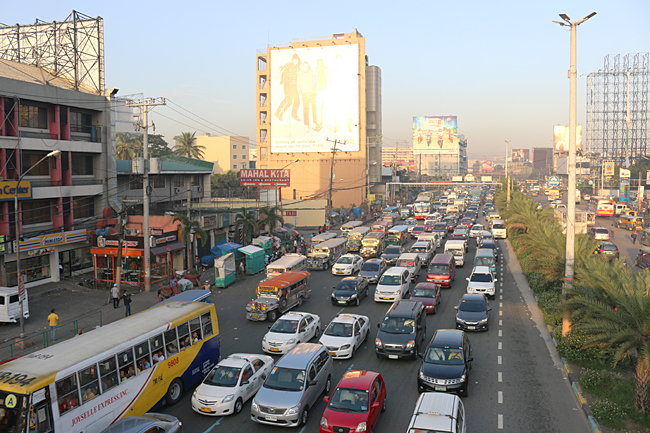

If you are a reader of The Gate, you likely travel around the world — or at least have been to one other country than the one in which you live — and having been caught in traffic during rush hour, you likely believe that the city with the traffic in the world that cost you the most money is whatever city in which you happen to be driving. Would that be correct?
The Cost of Rush-Hour Traffic in Major Cities Around the World to Motorists
If you do believe that, then you may incorrect, as the answer — without delving too much into the theory of relativity — is no. The cost of traffic during rush hour in some cities is regularly worse than others.
You might actually be surprised as to the cost of traffic during rush hour. If you disagree, please opine in the Comments section after the conclusion of this article.
I have been given express written permission to use the maps and the verbatim text from this article from Budget Direct, which highlights the cost to motorists of traffic during rush hour in 418 cities around the world. This information is general in nature only and does not constitute personal advice. While Budget Direct and Neomam Studios — which was commissioned to conduct research on behalf of Budget Direct — have endeavored to ensure the information provided is accurate and current, they cannot guarantee it. Neither Budget Direct nor The Gate accept liability for the information which is presented in this article.
The cost of rush-hour traffic per driver is a sum of the “value of time lost” plus “extra fuel cost.” Studies show motorists place a value on their time relative to their salary and are willing to pay for a reduction in travel time. Additional studies by CEBR show that the net effect of one hour stuck in traffic is a 30-minute loss in productivity, so the value of half the time spent in rush hour annually in each city was calculated using local salary data. The average annual cost of rush-hour traffic worldwide was calculated to be approximately $972.00 per motorist.
These figures were multiplied by 50 percent of the average local pay to calculate the dollar cost of lost productivity — which was based on a study by INRIX that showed every hour in traffic results in 30 minutes loss in productivity. Local fuel prices were also used to calculate the cost of extra fuel needed to drive the local average amount of time spent in traffic during rush hour.
The number of hours lost to congestion was taken from TomTom’s Global Traffic Index. Hourly pay for each city was estimated on the basis of adjusted net national income per capita by the World Bank. Fuel costs in each city were estimated as the cost of extra fuel needed to drive the given amount of hours in congested traffic, given the typical fuel efficiency in the corresponding country, the assumed average speed in congested traffic of 20 miles per hour or 32 kilometers per hour, the associated 80 percent increase in fuel consumption; and the recent price of petrol in a given city — where possible — or country.
For this article, the dollar amounts were converted from Australian dollars to United States dollars in the text — but they remain in Australian dollars in the graphics and charts.
Rush Hour Rates
Motoring expenses are shark-like in their stealth. You may be wary of the cost of buying a car (average $38,150) and fuel ($1,301 per year). But that’s just the fin of the shark.
The teeth are hidden underwater. A new car loses 10-20% of its value every year. The average cost of unexpected repairs is $817. And the toll on the environment is beyond mere dollars and cents.
But there’s more: what about all the other sharks swimming around you? Time wasted in traffic is rarely a consideration when totting up motor expenses. Yet, rush-hour congestion drains fuel, time, and productivity.
Key Findings
- Hong Kong is the city where rush hour costs motorists the most: $2,574 per year ($1,487 in lost income and $1,087 in extra fuel costs).
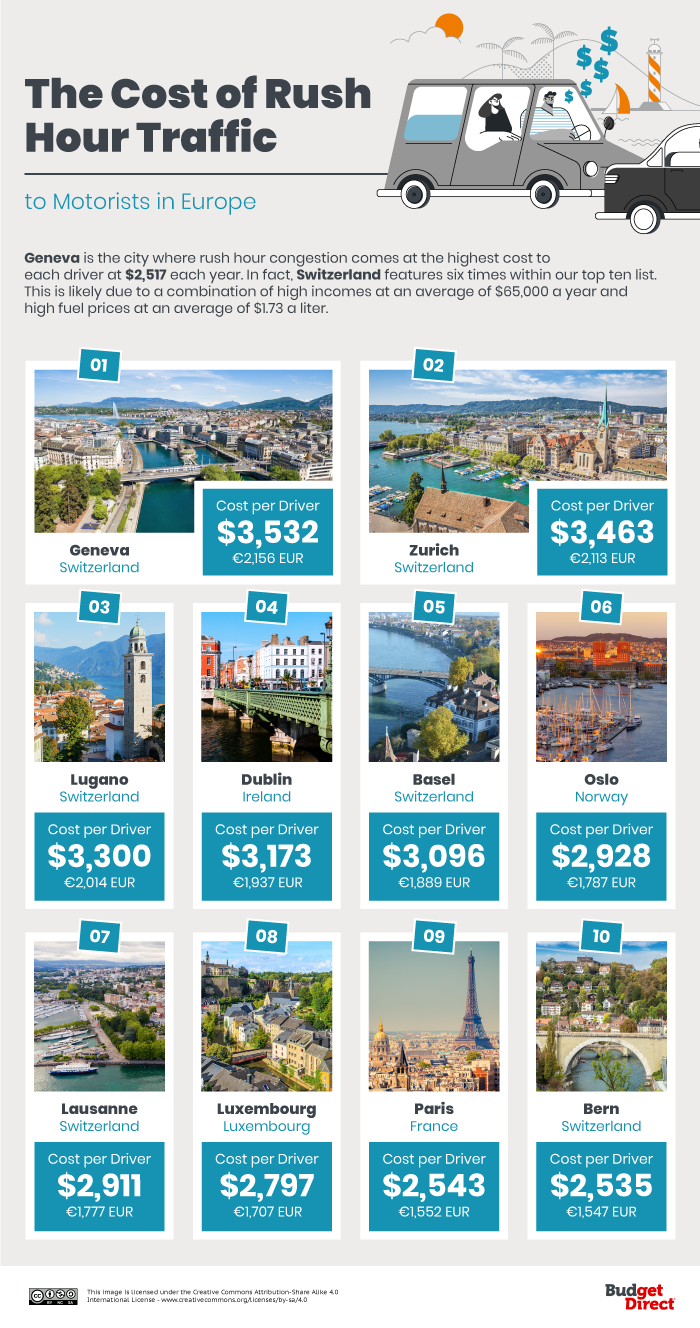
- The Swiss cities of Geneva and Zurich are where motorists lose the most income due to being stuck in traffic: $1,780 per year.
- The Australian city with the highest rush hour costs is Sydney ($1,687 per year).
- LA is the US city with the highest rush hour costs ($1,844 per year).
- Edinburgh is the UK city with the highest costs ($1,723 per year).
Rush-Hour Delays Cost Hong Kong Motorists $2,574 Per Year
Budget Direct found the average rush-hour delay, wage, and fuel cost for 418 cities worldwide and used them to calculate the average annual cost of rush-hour delays per motorist. We found that nine out of the top ten cities are European – but the world number one is the city of Hong Kong, known for the highest fuel prices in the world.
Swiss cities make up half of the global top ten. Switzerland has the highest national income per capita in the word, so time spent in traffic makes for a big hourly loss.
Oslo, Norway’s capital, also features in the top ten. Norway has the fifth-highest fuel costs in the world and is number seven for wages. However, electric cars now outsell fossil-fuelled cars in Norway. While the Norwegian petrol motorist loses $2,119 per year in traffic, including $676 in extra fuel, they could save around $523 by switching to electric (given that charging costs may be as low as 20% of petrol costs).
Sydney’s Motorists Pay $1,681/Year to Sit in Traffic
Sydney has Australia’s most congested roads, and the city’s motorists pay significantly more for the time they spend in traffic each year than anyone else: $1,681 against second-placed Hobart’s $1,367. Sydney falls just outside of the top 20 most expensive rush hours in the world.
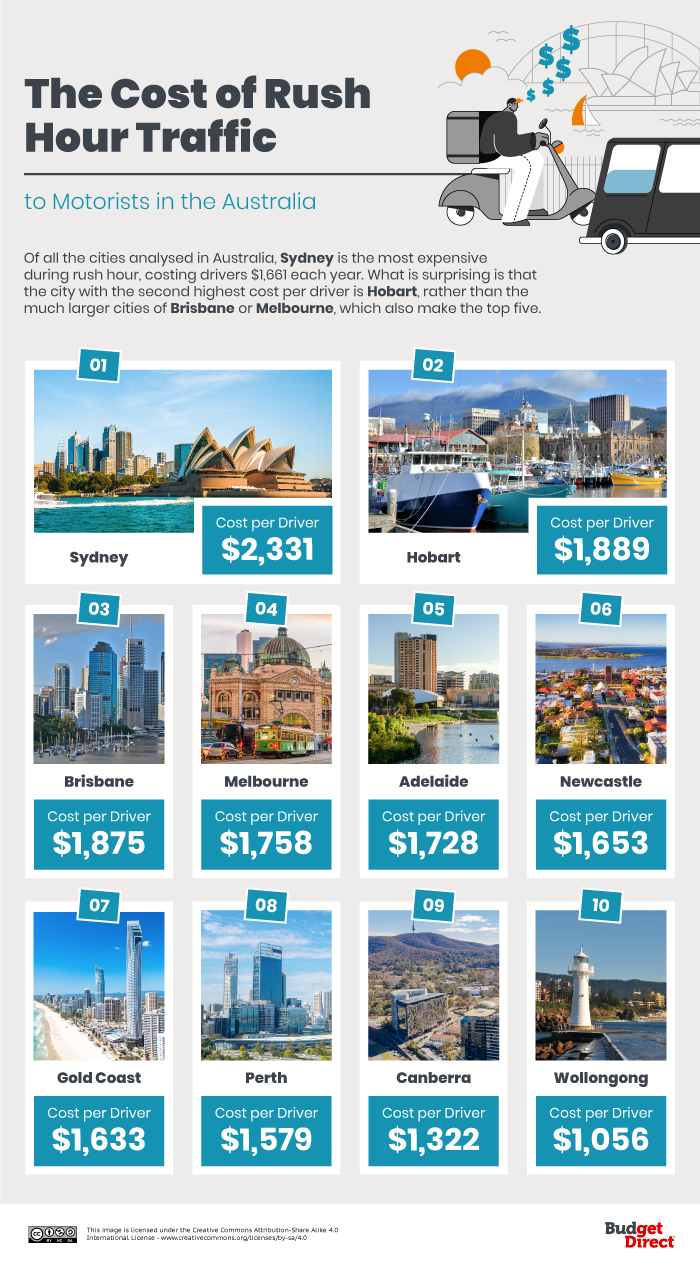
Budget Direct recently revealed that Hobart has the most expensive diesel and fourth-most expensive unleaded in the land. Our new study shows the toll this takes in traffic: Hobart’s motorists waste $661 in extra fuel stuck in traffic each year, contributing to a total cost of $1,889. Wollongong’s rush-hour premium is 45% that of Sydney’s, reflecting just 50 hours of congestion per person each year (against 112 in Sydney).
Los Angeles and New York City are the Most Expensive Places in the US to Get Stuck in Traffic
LA tops the table in the US, followed at a distance by New York City, with another substantial gap before the trailing pack. But it is not a pack you would want to lead: Los Angelenos pay $2,548 per year for the privilege of sitting in traffic jams for 101 hours each year.
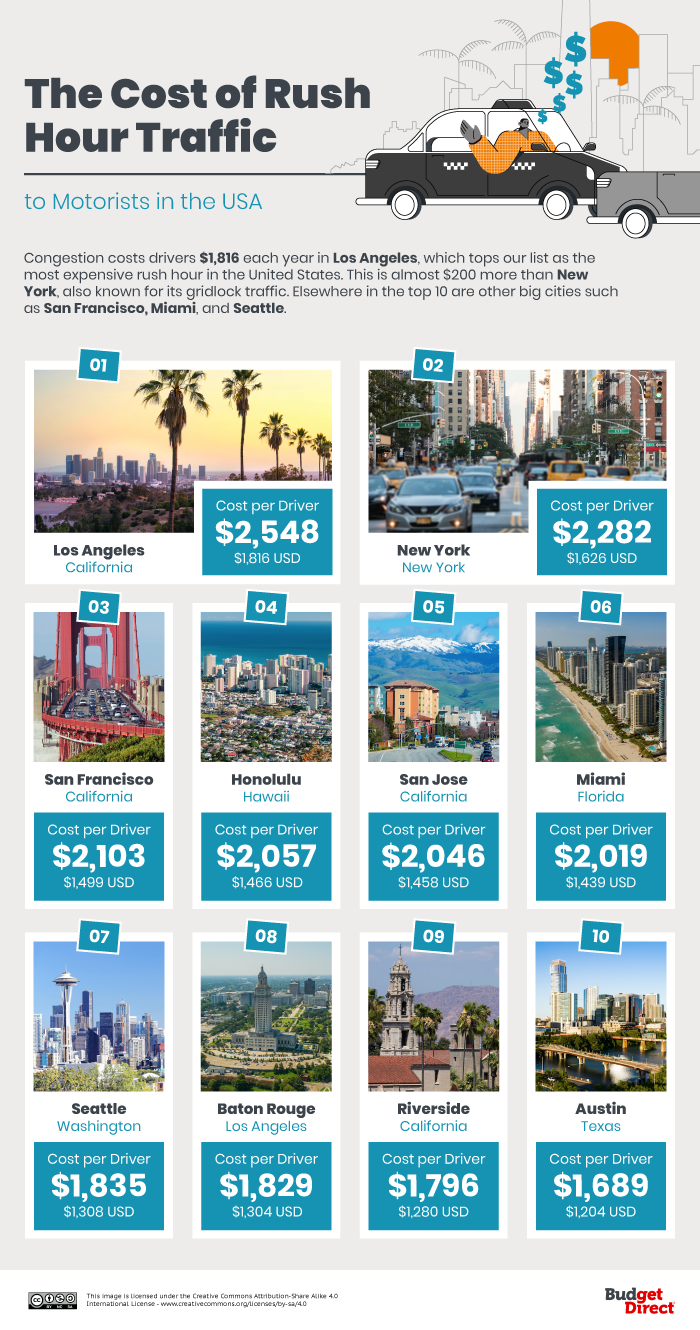
To non-Americans, it may be a surprise to see Honolulu, Hawaii, so high in the list of traffic costs. In fact, Honolulu is recognized for its terrible traffic, topping ‘most congested’ studies until recently and clocking up 82 hours of delays in a single, locked-down year.
Two UK Capital Cities Top Hidden Motoring Expenses Table: Edinburgh and London
Edinburgh just pips London to become the UK’s most costly city for rush-hour traffic. The two capitals have near-identical statistics, but the Scottish city edges it on congestion hours (119 vs. 115) and fuel costs ($1.68 vs $1.67 per litre).
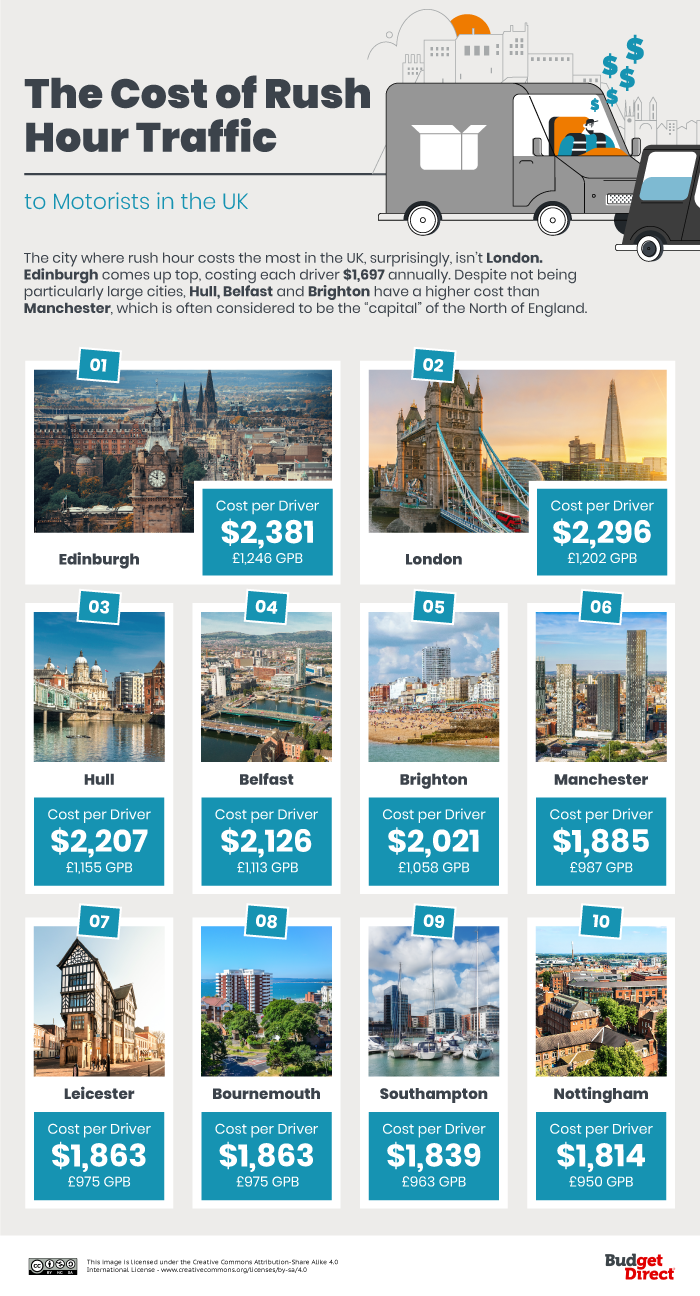
Another capital city, Belfast, takes fourth place. More surprising is the coastal city of Hull, sandwiched in third place with an annual traffic jam cost to drivers of $1,597. But Hull has the UK’s third-most congested roads, and fuel is pricier here than in any of the UK’s capital cities.
How Much Do Traffic Jams Cost Your City?
Traffic jam costs are a mighty pile-up of ingrained bad habits: poorly planned road infrastructure, an insistence on driving to work instead of cycling or public transport, and a planet-busting loyalty to fossil fuels.

But with the work-from-home and flexitime boom, the culture of commuting is in the midst of a revolution. Those who still travel to work may do so at different times. Quieter roads and emissions targets may lead to more sensible urban planning – and more sensible motoring.
In case you need to shock yourself out of the habit of snailing to work through traffic, use our interactive below to discover the annual cost of rush-hour congestion to motorists in your city. Your savings might be enough to buy a bicycle (or upgrade to an electric car…).
Final Boarding Call
This article pertains to the cost of rush-hour traffic to motorists in major cities around the world — but you can also read this article as to which cities around the world have the worst rush-hour traffic.
I am not sure why the chart of Europe was not included in the original article — but here it is:
Having traveled yourself, you could anecdotally add to this list, which may seem to be incomplete to you, as you probably remember the costliest rush hour traffic in which you have ever been stuck may likely not be included in the aforementioned lists…
…and does the worst traffic have to be during rush hour and within a city? I would argue no — and as an example, I have been stuck in traffic on the Brooklyn-Queens Expressway at 3:00 in the morning. Also, consider when I was stuck in traffic at the border crossing from South Africa into Lesotho for at least four hours as another of many examples.
Please post your costliest traffic experience — as well as where it was located — in the Comments section below.
Thank you in advance.
Photograph ©2014 by Brian Cohen.
