
When you consider that each one of at least 1.5 billion motor vehicles carries at least one human life, that as many as 1.35 million people die in road crashes every year, according to the World Health Organization should be of no surprise — even though the majority of drivers are working full-time to avoid colliding with others — and this article reveals what are the most dangerous roads in countries around the world. Greater than half of these deaths are among pedestrians, cyclists, and motorcyclists…
What Are The Most Dangerous Cities and States to Drive in the United States?
…but what are the most dangerous cities in which to drive in the United States?
To find out the answer to that question and determine the most dangerous places to drive, data on car accidents reported from 2016 to 2020 was collected from the National Highway Traffic Safety Administration.
Then — to find the number of accidents per 100,000 cars — data about the population of each state was collected; and the total number of vehicles in each state was extracted. Second, the number of cars per capita was calculated. Third, these indices to estimate the number of vehicles in each city of the top 100 most populated cities in the United States were used. Data on population came from the Census Bureau of the United States. At the county level, only counties with a population of at least 50,000 were kept. Finally, the number of accidents per 100,000 vehicles yearly was calculated.
To reveal the places where it is more dangerous to drive at night rather than a day, all accidents were split into two categories, “dark” and “day.” Included in the “dark” category were the accidents with the following lighting types noted: ‘Dark – Not Lighted,’ ‘Dark – Lighted,’ ‘Dark – Unknown Light.’ Included in the ‘day’ category were only those accidents that occurred under the illumination: ‘Daylight.’ Data on light conditions came from the National Highway Traffic Safety Administration of the United States.
The data was collected in March 2022.
This article from The Clunker Junker gives more details about the most dangerous cities to drive in the United States; and I have been given express written permission to use the graphs and the verbatim text from the aforementioned article in this article. While The Clunker Junker has endeavored to ensure the information provided is accurate and current, it cannot guarantee it, as this information is general in nature only and does not constitute personal advice. Neither The Clunker Junker nor The Gate accept any liability — and assume no responsibility — for any and all information which is presented in this article.
With that disclaimer out of the way, here is the article.
The Most Dangerous Cities and States to Drive in the United States
The decline in motor vehicle fatalities was one of the great public health achievements of the 20th century. The number of motor vehicle deaths per capita has fallen by more than half in the last 50 years, declining from 26.8 per 100,000 Americans in 1970 to 12.9 per 100,000 in 2020.
Despite the decline, more than 1.3 million people are still killed in automobile accidents every year. In fact, car crash injuries are the eighth leading cause of death worldwide and the leading cause of death for people aged 29 and younger.
Differences in roadway design, driver behavior, weather conditions, and other regional factors make some areas far more dangerous to drive in than others. But where in the states should you take extra care when getting behind the wheel?
Car experts at The Clunker Junker have analyzed data from the National Highway Traffic Safety Administration to determine the most dangerous places to drive in the U.S., ranking each state on the number of annual car accidents per 100,000 registered vehicles.
Key Findings
- Mississippi is the most dangerous state for driving, with 30.1 accidents per 100,000 vehicles every year.
- With 24.9 accidents per 100,000 vehicles each year, Baton Rouge is the most dangerous city for driving.
- California and Texas are home to the most dangerous cities to drive in at night — Chula Vista is the most dangerous, with 74.6% of all reported car accidents occurring at night.
- In 18 of the 25 most dangerous counties for driving, more than half of the population lives in rural areas.
Mississippi Reports More Car Accidents Than any Other State
The most dangerous states to drive are places where residents use their cars the most. In Mississippi, drivers put an average of 13,700 miles on their cars per year, the fourth-most vehicle miles traveled per capita of any state. With 30.1 accidents per 100,000 vehicles every year, the magnolia state is the most dangerous for driving — according to our research.
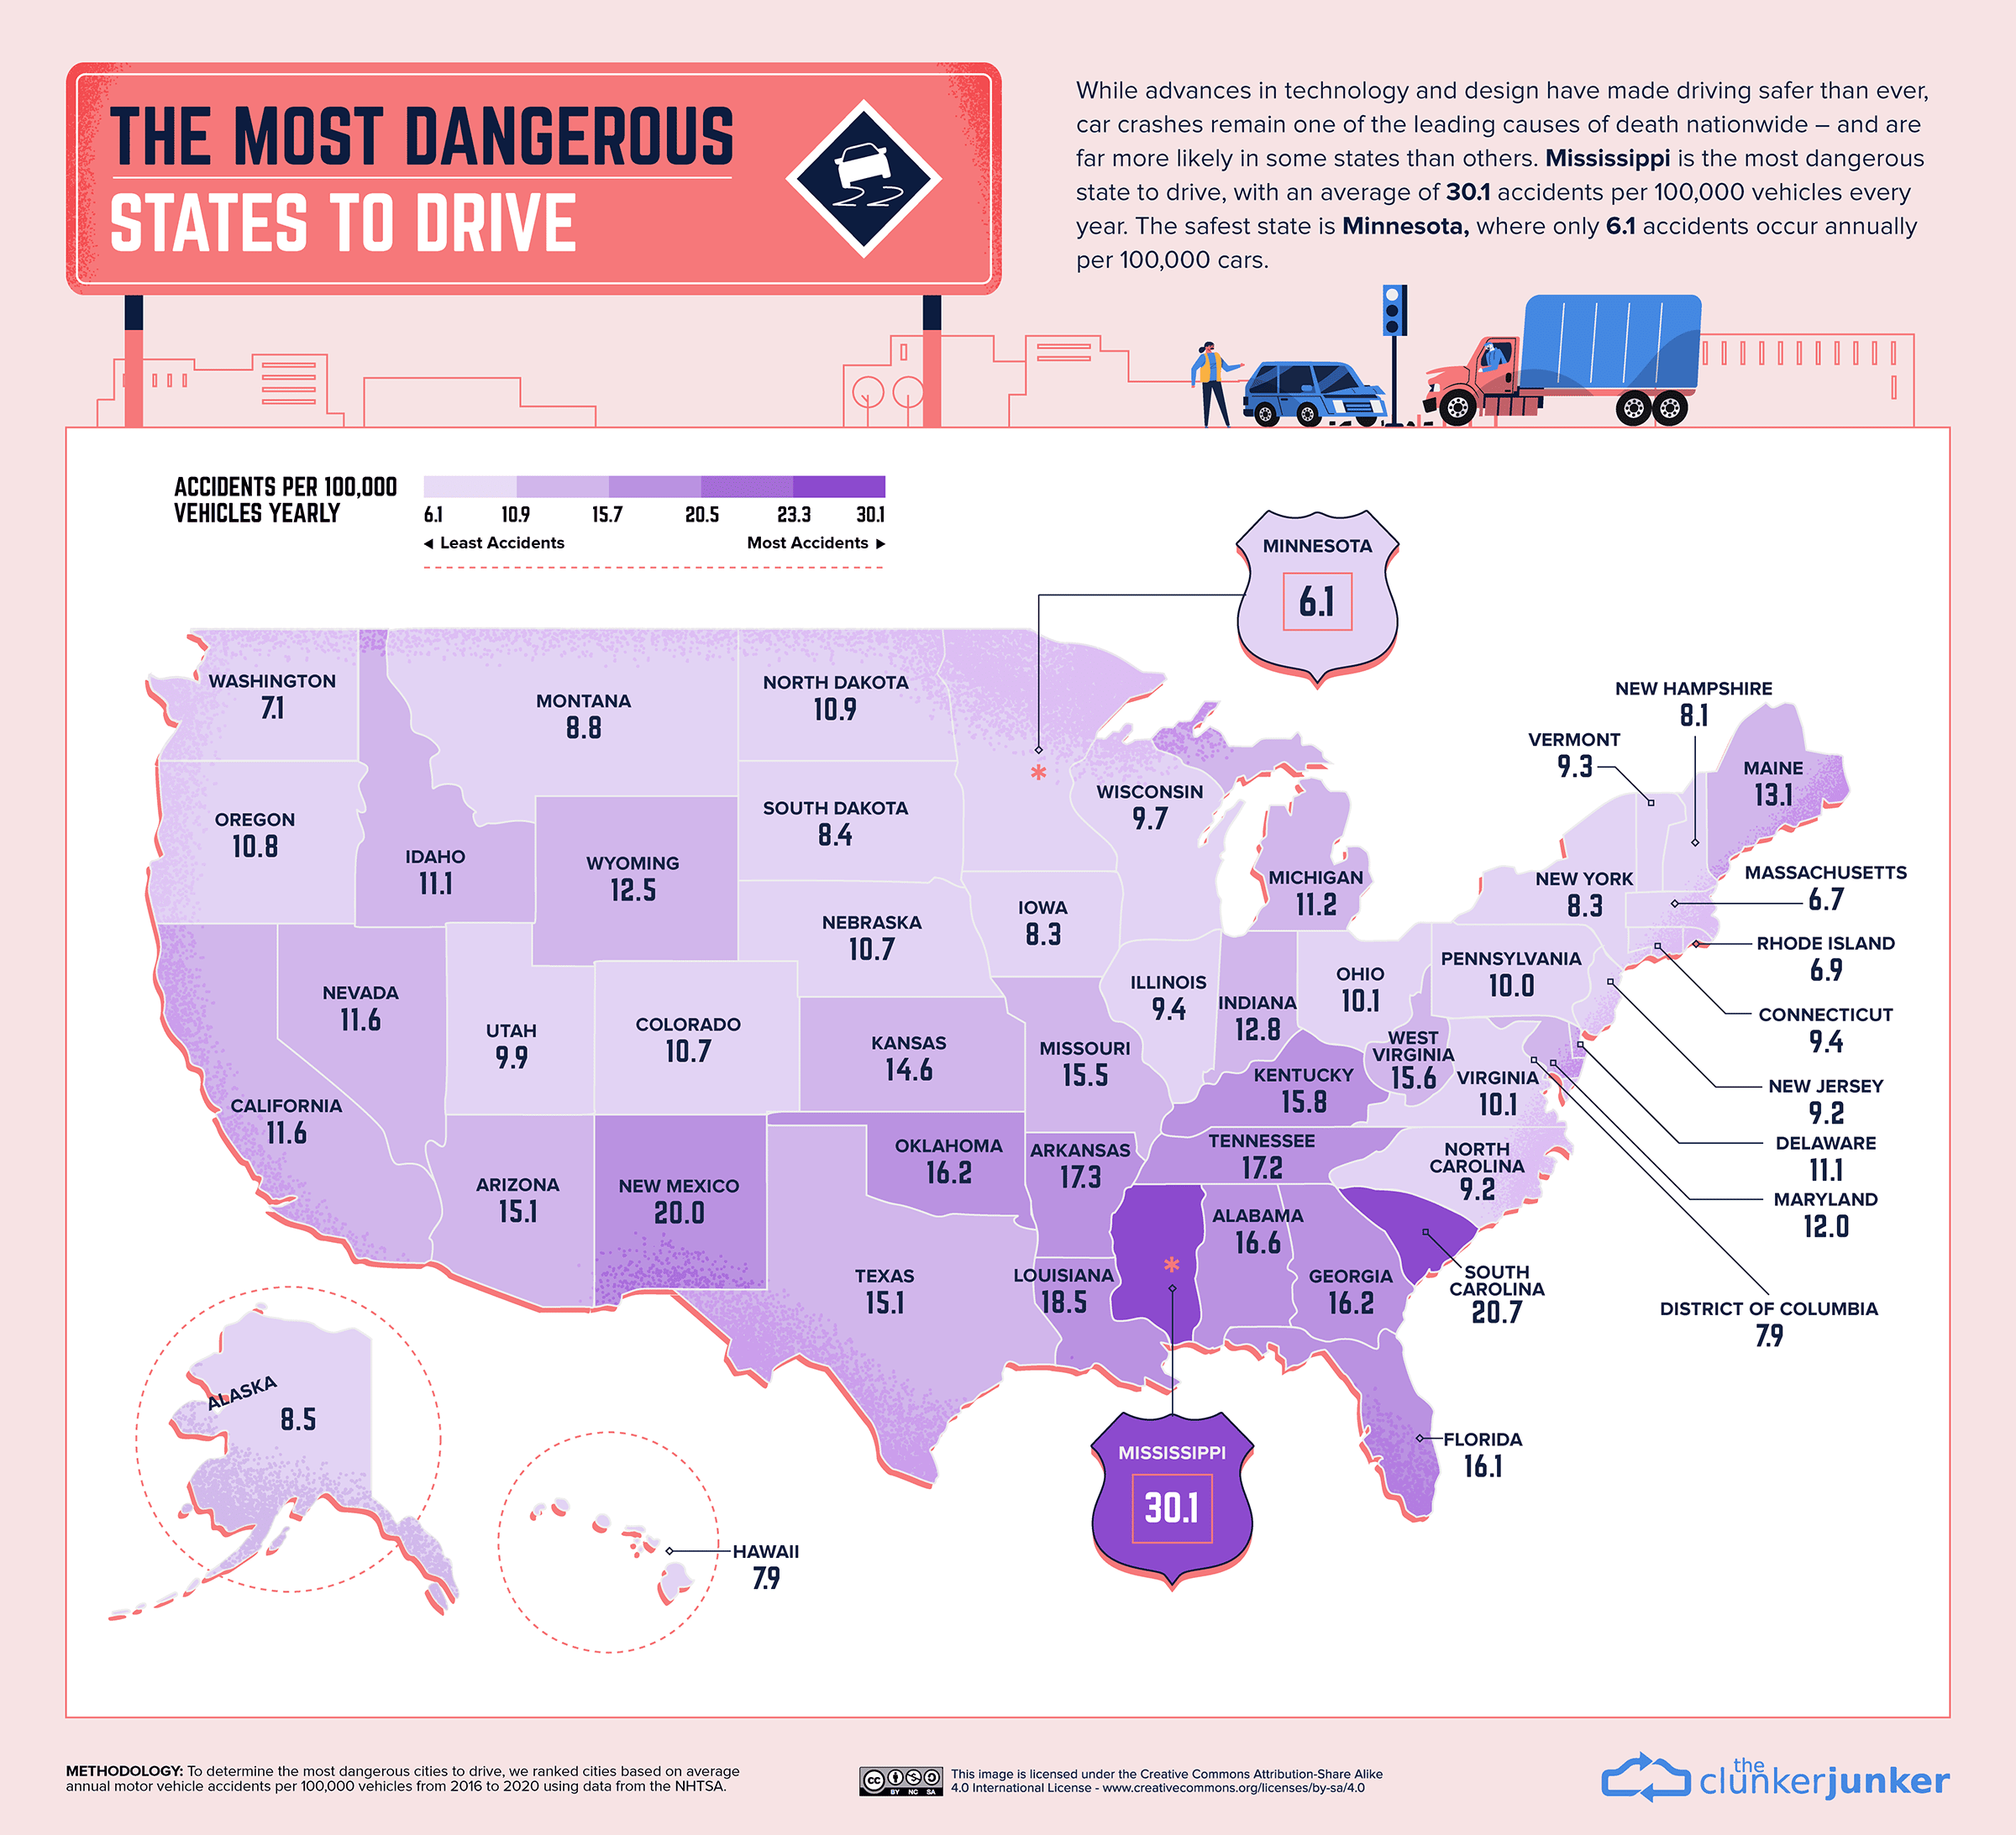
Drivers in New Mexico average 14,200 miles per year, and drivers in Alabama average 14,500 miles a year. These two states place third- and eighth-most dangerous for driving, respectively. The increased car use, combined with the high speeds and low visibility of rural roads, makes these Southern states some of the most dangerous places for driving in the United States. Meanwhile, Minnesota is the safest state to drive in, with 6.1 accidents occurring annually per 100,000 cars.
Southern Cities Lead the 10 Most Dangerous Cities to Drive
While motor vehicle crash deaths are nearly twice as likely to occur in rural areas than in urban areas, cities have specific characteristics that make driving more dangerous and increase the likelihood of car accidents. Pedestrian and bicyclist activity, tailgating and traffic jams on multi-lane freeways, potholes, and confusing one-way streets can all make city driving more dangerous. Cities with a high degree of sprawl also tend to have more accidents per capita, as drivers in sprawling areas travel at higher speeds and are required to drive more often overall.
Using data from the NHTSA, we identified the 10 cities with the highest number of motor vehicle accidents per 100,000 vehicles from 2016 to 2020.
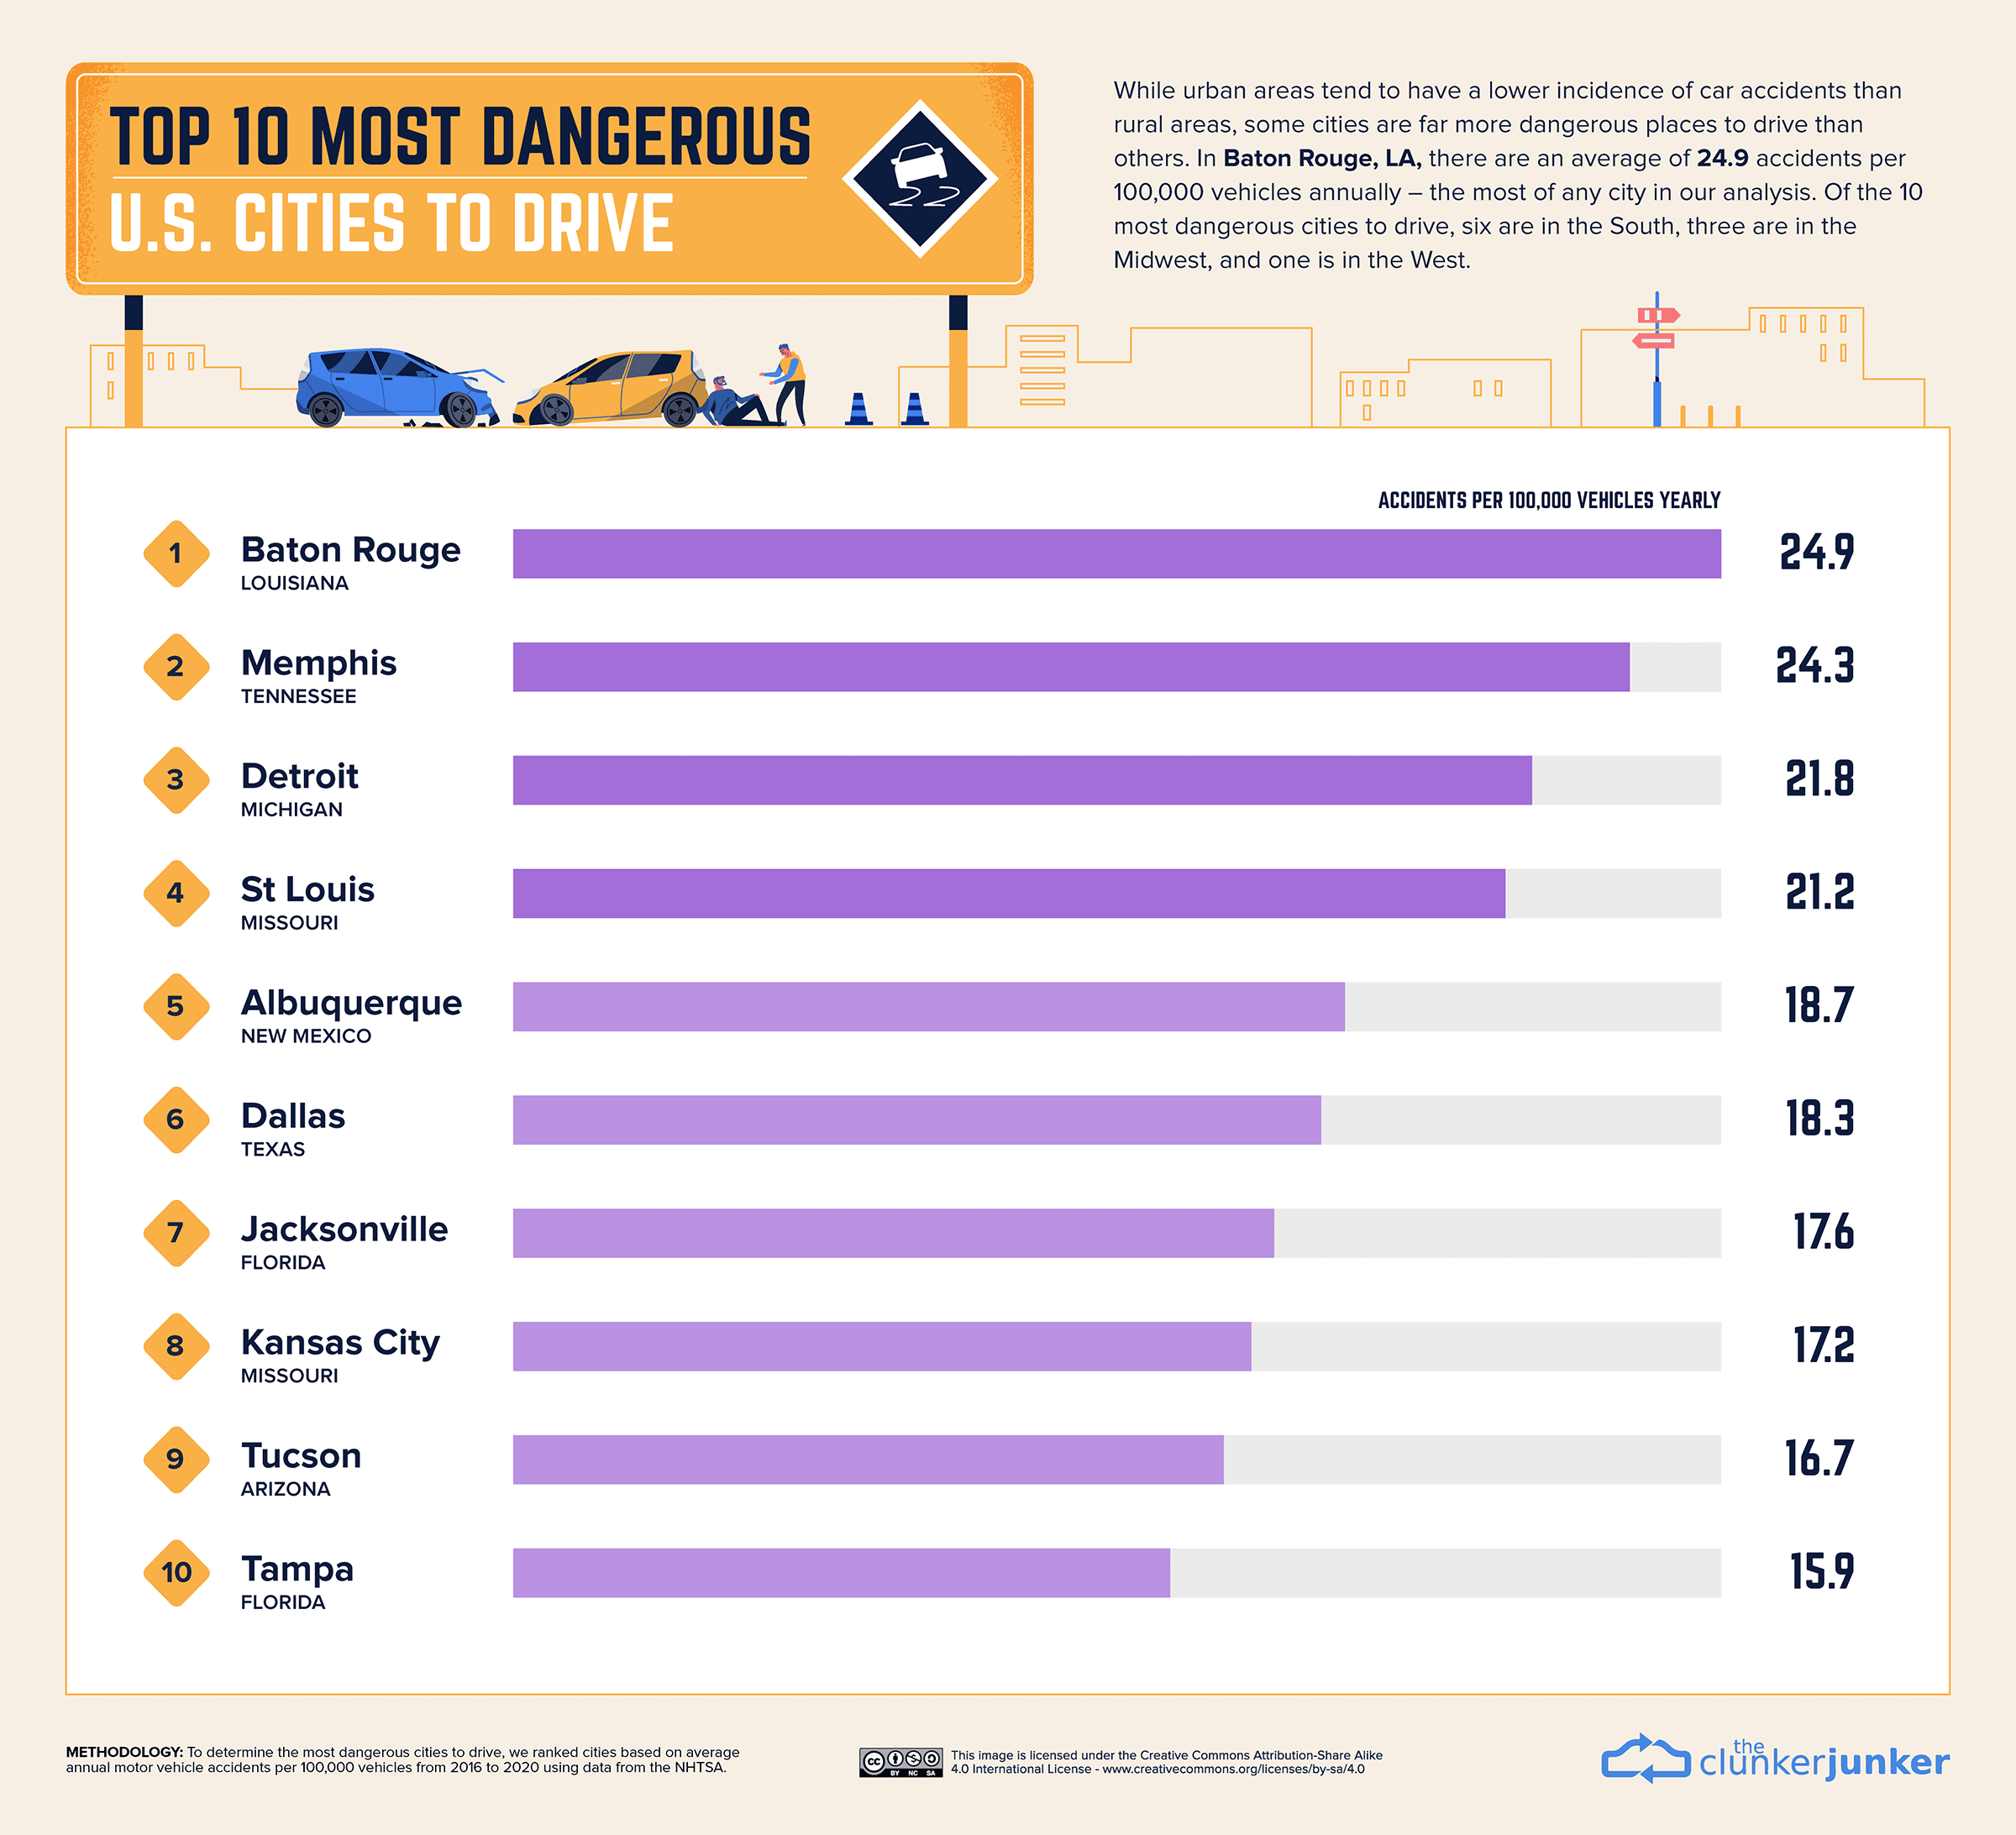
According to our analysis, Baton Rouge, the capital and second-largest city in Louisiana, reports an average of 24.9 accidents per 100,000 vehicles annually, making it the most dangerous city for driving. In 2014, the city gained the dubious distinction of being the most sprawling midsized metro in the U.S.
Of the 10 most dangerous cities to drive, 6 are in the South, 3 are in the Midwest, and 1 is in the West. Most of the cities are mid-size metro areas with a mix of urban and suburban development.
Rural Counties Are the Most Dangerous for Driving
Looking at the rate of accidents per capita at a county level shows an even greater disparity in driving deaths throughout the United States. Many of the most dangerous counties are in rural areas, where high speeds, fatigue associated with long driving distances, and poor visibility combine to make for dangerous driving conditions. In 18 of the 25 most dangerous counties for driving, more than half of the population lives in rural areas.
County-level accident data also highlights dangerous regions in otherwise safe states. For example, motorists driving through New York — the eighth-safest state for driving — increase their likelihood of getting in an accident by more than three times when they enter Genesee County, where there are 28.2 accidents per 100,000 vehicles annually. Similarly, drivers in Washington, the fourth-safest state, increase their likelihood of getting in an accident by more than double when they enter Grant County, where there are 17.1 accidents per 100,000 vehicles annually.
California and Texas Home to the Most Dangerous Cities For Driving in the Dark
While only 25% of travel occurs at night, nearly 50% of fatal car accidents occur after the sun goes down. In some cities, the disparity is even greater, with more than two in three car accidents occurring at night. A number of factors play a part in the increased risk, such as fatigue and low visibility. To determine the most dangerous cities for night driving, we ranked the 100 most populated U.S. cities based on the percentage of accidents that occur after dusk — both with illumination from streetlights and without — with data from the NHTSA.
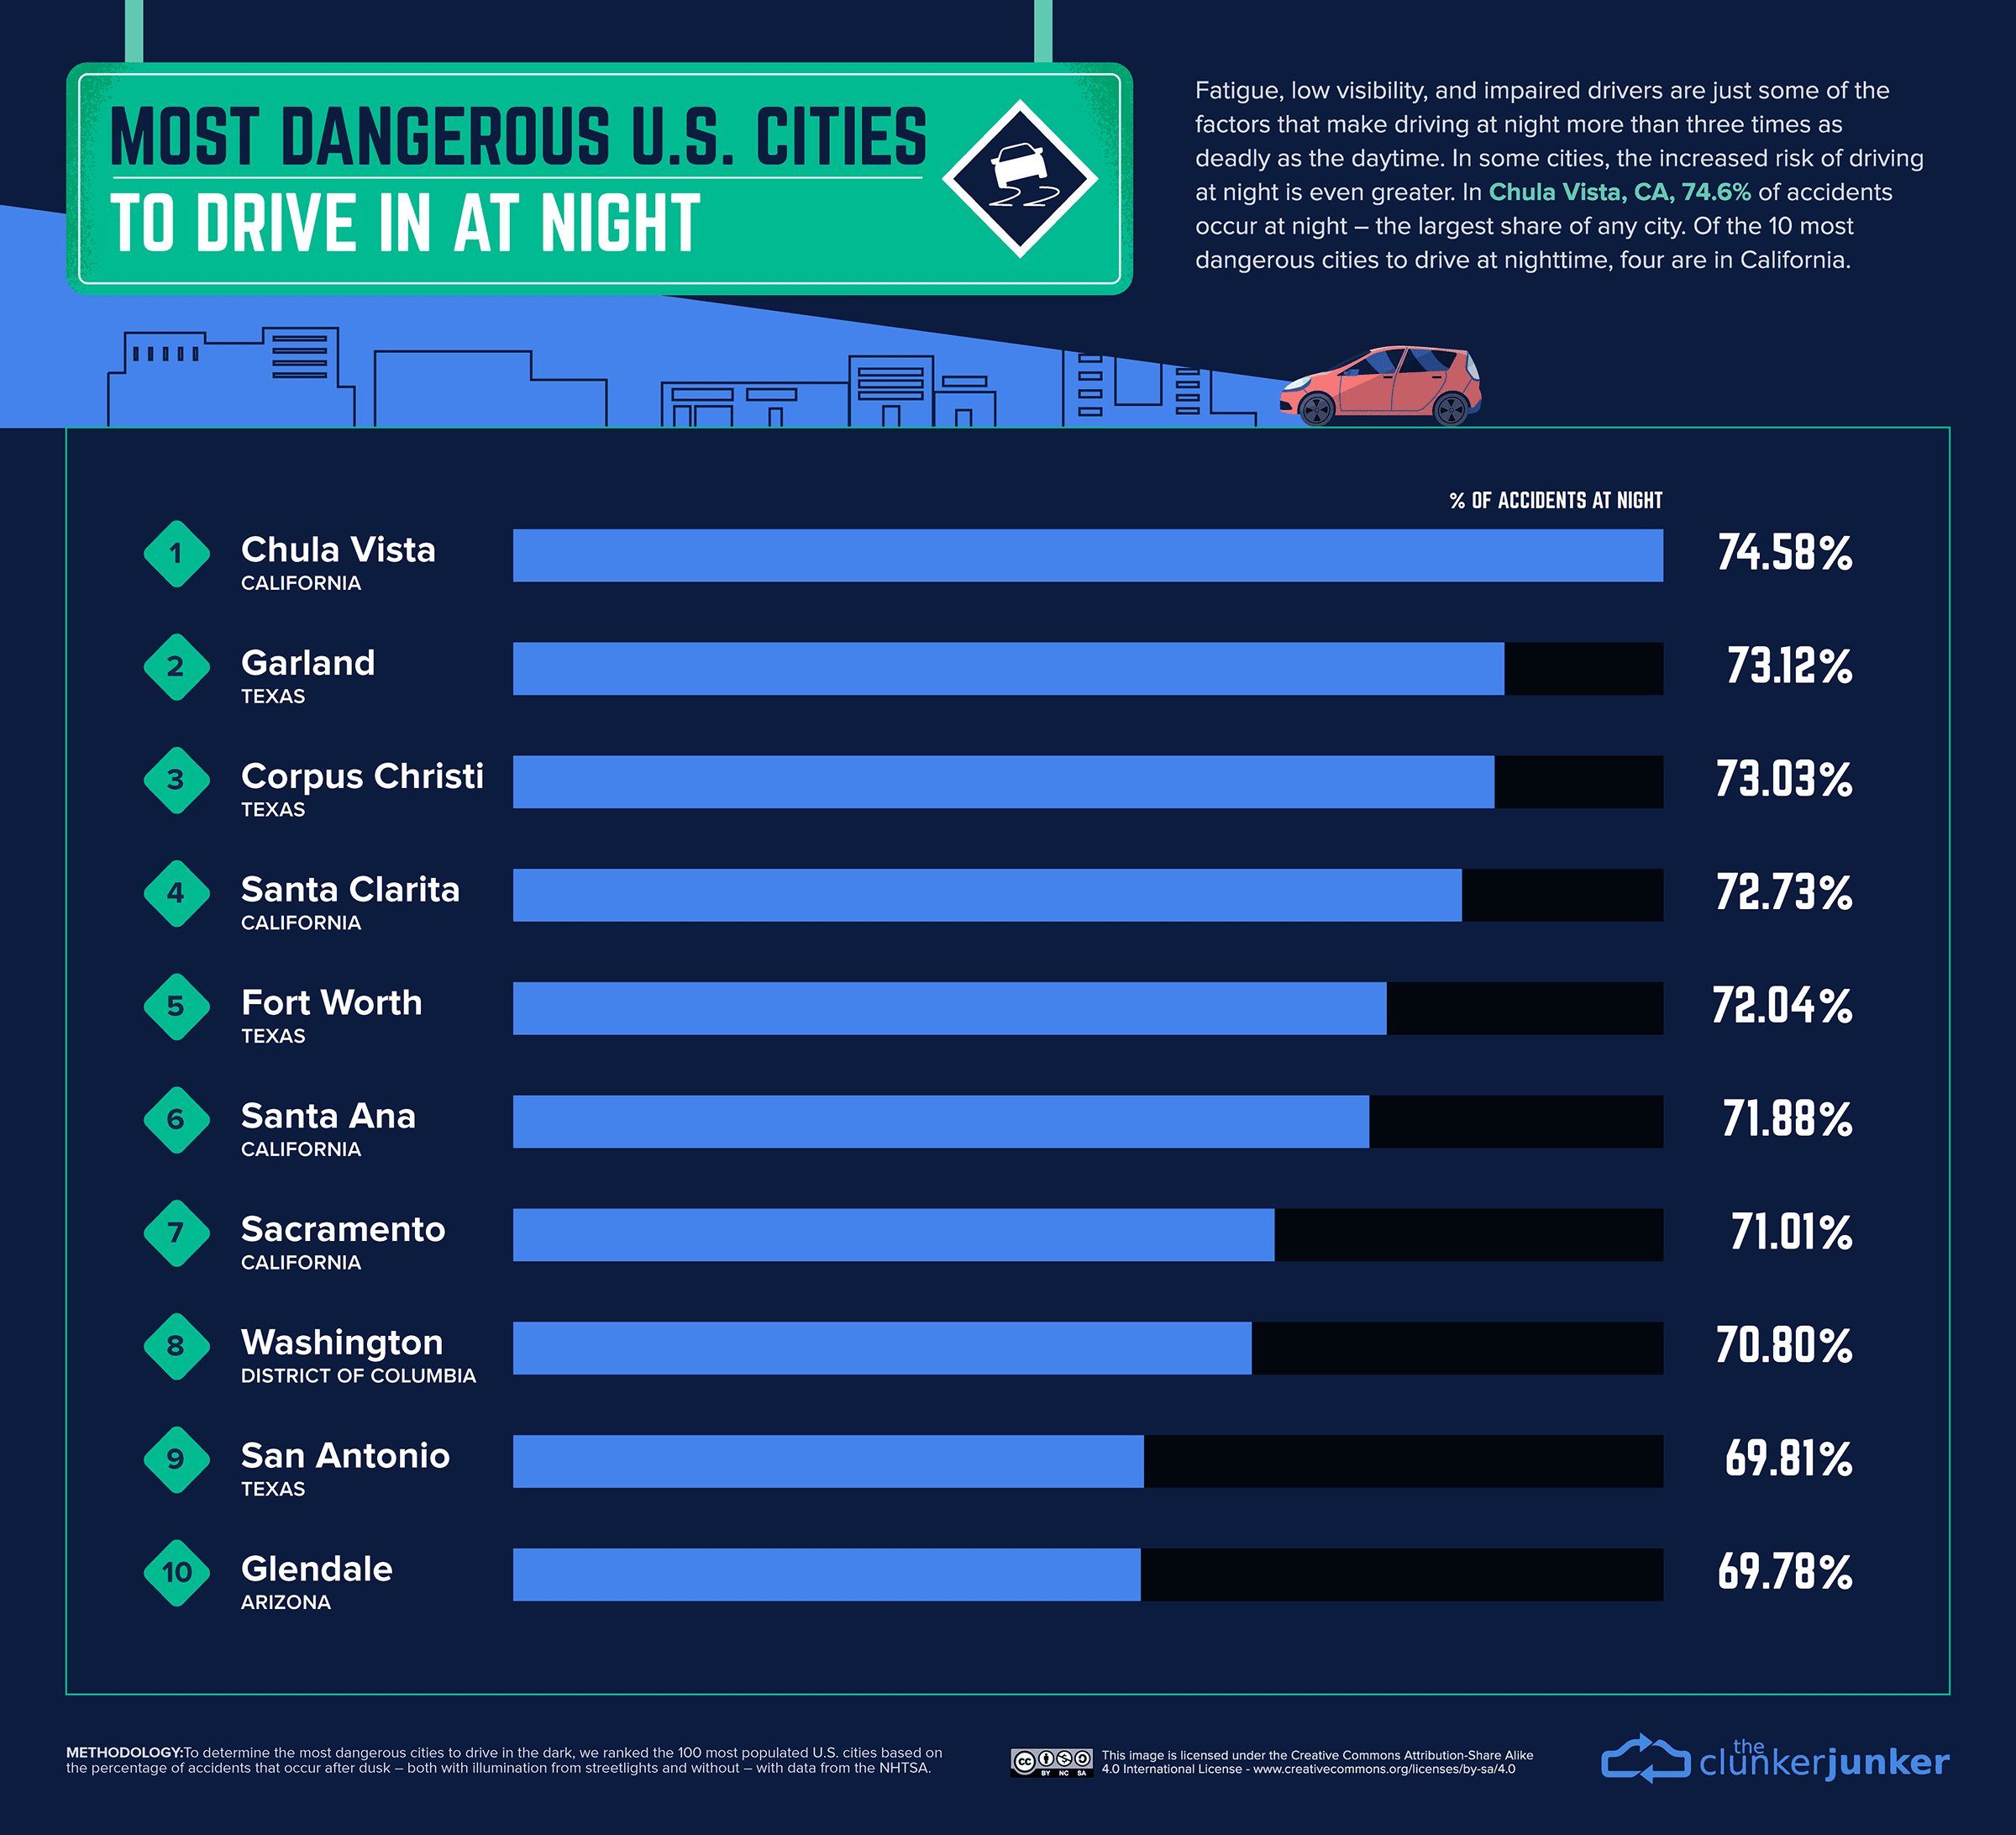
The states of California and Texas are each home to four of the top 10 cities with the most nighttime accidents. Chula Vista, the second-largest city in the San Diego metropolitan area and the seventh-largest city in Southern California, is the most dangerous city to drive after dark. 74.6% of all reported car accidents occur at night, which is the largest share of any city.

Washington, D.C. ranks eighth on the list, while Glendale, Arizona, ranks tenth.
Dangerous Driving Starts and Ends with a Dangerous Driver
The rate of car crashes per 100,000 vehicles at various levels of geography shows a range of locations where drivers are more likely to get in an accident. From sprawling metropolises to mid-size cities, including both rural and urban areas, the most dangerous U.S. cities and states for driving are scattered right across the map.
Cautious motorists may want to look through the table below to find the cities, counties, or states they should be wary of driving through on their next road trip.
While it can be useful to know which areas are more prone to car accidents and fatalities, the real risk factor to consider when driving is other people. Whether you are commuting to and from work, paying a visit to family or friends, or are road tripping across the country — remember to keep your eyes on the road and your hands firm on the wheel.
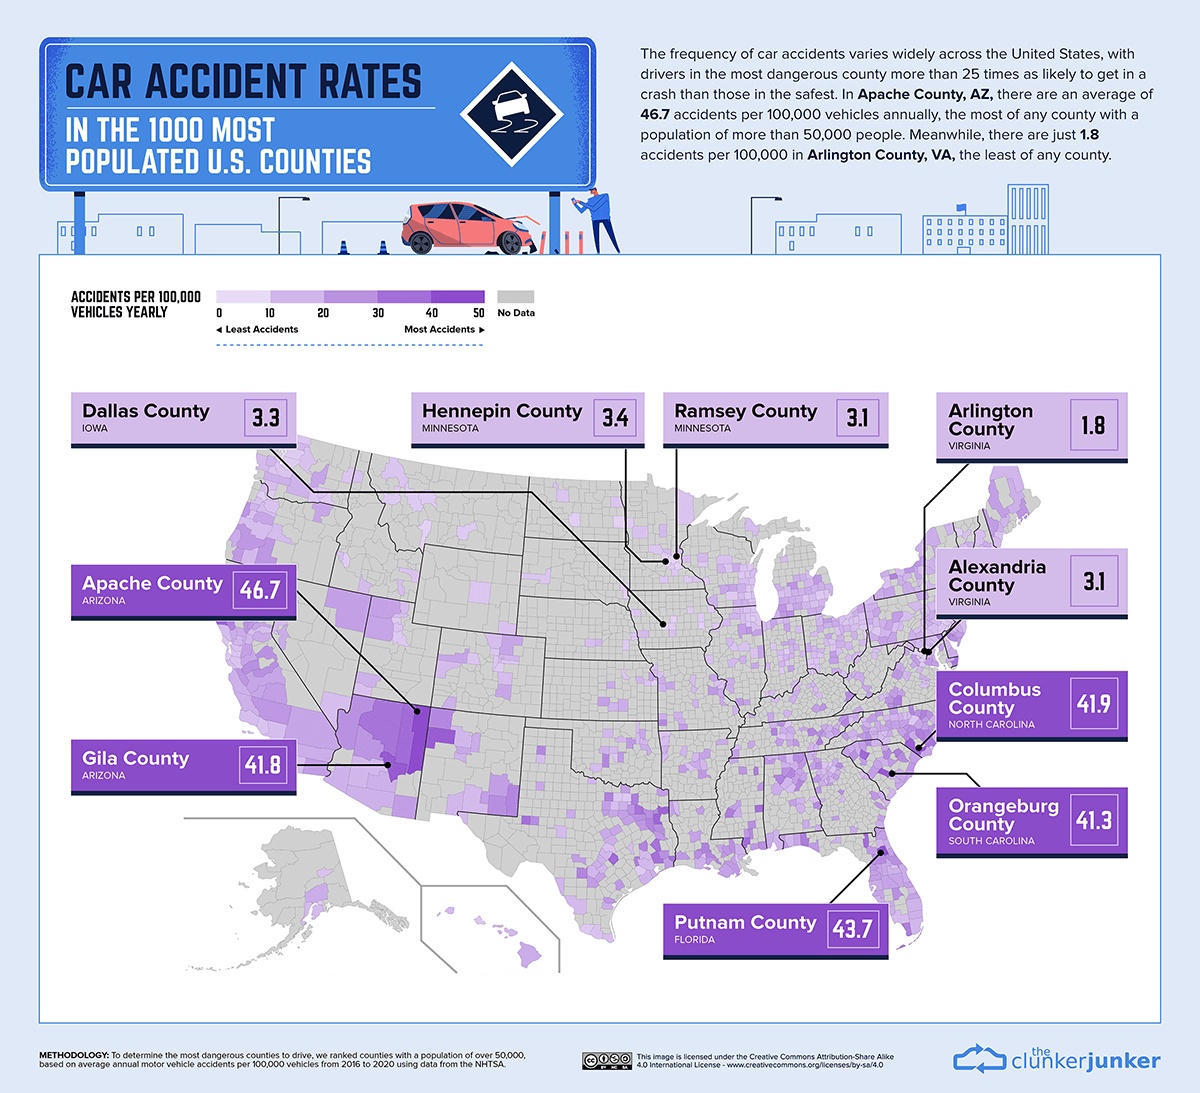
Bonus: Car Accident Rates in The Most Populated Counties in the United States
Not included in the original article is the following graphic, which shows that 46.7 accidents per 1,000 vehicles occur annually in Apache County in Arizona; while only 1.8 accidents per 1,000 vehicles occur annually in Arlington County in Virginia. One thousand counties with a population of at least 50,000 people were included for this graphic.
Final Boarding Call
Extensive transportation systems certainly helped to keep cities such as New York off of — or, at least, rank low on — the lists…
…although the District of Columbia is a notable exception.
Anyone can become involved in a motor vehicle accident when he or she least expects it — so I hope that you travel safely and always arrive at your destination unscathed.
Photograph ©2020 by Brian Cohen.
